Navigating Rates

The case for short duration, high yield bonds

With interest rates peaking, shorter maturity high yield bonds could offer a combination of healthy income and lower volatility.

Key takeaways

  • US high yield bonds were one of fixed income’s top performers in 2023 but yields remain high by historical standards.
  • Current yields in the US high yield bond market have historically been associated with strong returns in the ensuing 12-24 months.
  • Short maturity (1-2yr) high yield bonds could offer access to elevated yields but typically with lower volatility.
  • Healthy fundamentals such as low net leverage and healthy interest coverage can help defend returns against a more severe slowdown than is currently anticipated.

Looking at asset performance across 2023 it was little surprise to see US high yield bonds topping the fixed income charts, far outstripping the returns on perceived lower risk assets such as US investment grade corporate bonds and US Treasuries.1

High yield bonds (bonds issued by companies with credit ratings below BBB-) pay investors a credit spread over “risk-free” assets (such as US Treasuries) to compensate for expected losses stemming from defaults, plus an extra amount to reflect the greater volatility of the asset class. Investor appetite for high yield bonds thus tends to increase as their assessment of economic conditions improves, since a stable or growing economy reduces the risk of corporate defaults. This can occur both in the primary market, where investors demand lower yields for newly issued bonds, and in the secondary market, where increased demand for high yield bonds sees prices rise and yields fall.

In this context, high yield’s recent outperformance has partly reflected fading expectations of a US recession. At the beginning of 2023, markets were still unsure where and when US interest rates might peak, and whether the lagged effect of substantial rate hikes from the US Federal Reserve would lead to an economic downturn as companies faced mounting funding costs. But with inflation coming down steadily and economic data seemingly holding firm, markets have become increasingly confident that US interest rates have peaked and the economy will avoid the sort of “hard landing” that would trigger a sharp rise in high yield default rates.

In our view, US high yield bonds offer competitive yields and healthy fundamentals. In addition, shorter maturities could provide better risk-adjusted returns in an environment of uncertainty around the strength of the US economy.

Today’s yields suggest potentially strong near-term returns
For the broader US high yield market, yields remain just under 8% after the recent sharp rise in interest rates.2 According to a 2022 study by JP Morgan analysing 35 years of performance data, this bodes well for future total returns (see Exhibit 1). When high yield bonds have been in the 8-9% range, returns over the ensuing 12-24 months have historically been in the mid to high single digits, on average.
Exhibit 1: Today’s yield levels have historically been associated with strong returns
High yield forward return (%) over X months (Jan 1987 – Oct 2022)

Source: JP Morgan, data as at October 2022. Based on JP Morgan Domestic High Yield Index. Performance for periods greater than one year have been annualised. Past performance, or any prediction, projection or forecast, is not indicative of future performance.

Fundamentals look supportive despite macro uncertainty

Under classic “late cycle” conditions, when interest rates are peaking and markets would typically begin to price in a coming recession, investors tend to become wary of high yield bonds as lower quality credits are more vulnerable to the higher cost of debt.

In response, the credit spread high yield bonds pay over “risk-free” assets such as US Treasuries tends to widen (with bond prices falling) as investors demand more compensation for the rising risk of high yield issuers defaulting.

However, credit fundamentals can help investors gauge the financial strength of high yield issuers, and today several of these metrics suggest the sector can cope with tighter conditions:

  • Low net leverage – Debt as a proportion of equity or earnings is a key measure of financial strength for high yield issuers. As of end-Q3 2023, net leverage (a measure of debt divided by cash profit) across US high yield issuers was 3.44x, above the lows of late 2022 but also well below previous peaks of around 5x in 2021 and 4.7x in 2016-17.3
  • Healthy interest coverage – The amount of cash firms have on hand to pay the interest on their debt can be expected to deteriorate given higher refinancing costs, but it is starting from a healthy level as issuers did an impressive job of extending maturities on attractive terms in 2020 and 2021. As of end-Q3 2023, interest coverage across US high yield was around 5x – still well above dips below 3.5x in 2011, 2013 and 2016.4
  • Low maturity wall – High yield investors keep a close eye on when maturing bonds will require issuers to refinance at current market levels (widely known as the “maturity wall”). Currently US high yield issuers’ near-term refinancing obligations are low by historical standards (see Exhibit 2), with only USD 115.3 billion of bonds maturing in 2024-2025.5
  • Lower CCC exposure – Today’s US high yield market includes a lower-than-normal exposure to CCC rated bonds, which have historically had higher default rates than higher-quality bonds.6
Exhibit 2: Near-term refinancing needs remain manageable
US high yield bond and leveraged loan maturities

Source: Bank of America HY Chartbook, data as at 29 December 2023. Past performance, or any prediction, projection or forecast, is not indicative of future performance.

Focus on the short end of high yield

Within high yield bonds, shorter maturities benefit from two favourable characteristics.


1) A historically better risk-return ratio than longer dated bonds

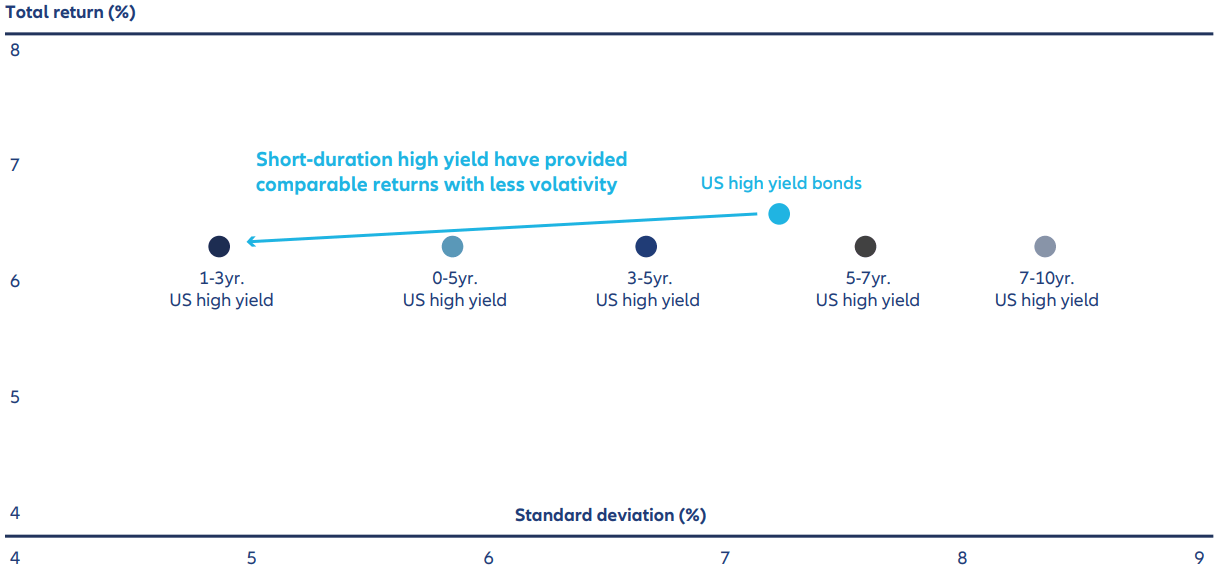
The short end of the US high yield market (as measured by the 1-3 year US High Yield Index) has provided comparable returns to the broader US high yield market, but with significantly lower volatility
(see Exhibit 3).

One reason for this is a phenomenon known as “pull-topar”. As a bond approaches its maturity date, its price will “pull” towards its par value as default risk becomes increasingly negligible (this occurs whether the bond has risen or fallen in price since it was issued). This effect is more powerful in shorter maturity bonds since they are closer to the maturity date when bondholders are repaid at par. In other words, shorter maturity high yield bonds are less exposed to a deterioration in economic conditions that would increase default expectations.

Exhibit 3: Short maturity HY has provided comparable returns with lower volatility

Data: November 2009 to December 2023. Source: Voya Investment Management, FactSet, ICE Data Services. Past performance, or any prediction, projection or forecast, is not indicative of future performance. This statement reflects performance and characteristics for the time period shown, results over a different time period may have been more or less favourable. The performance shown above is gross and does not reflect the deduction of investment advisory fees. 1-3 Yr: ICE BofA 1-3 Year US Cash Pay High Yield Index, 3-5Yr: ICE BofA 3-5 Year US Cash Pay High Yield Index, 5-7Yr: ICE BofA 5-7 Year US Cash Pay High Yield Index, 7-10Yr: ICE BofA 7-10 Year US Cash Pay High Yield Index, US High Yield Bonds: ICE BofA US High Yield Index; 0-5Yr: ICE BofA 0-5 Year US High Yield Constrained Index. Investors cannot invest directly in an index. Index returns are presented as net returns, which reflect both price performance and income from dividend payments, if any, but do not reflect fees, brokerage commissions or other expenses of investing. Individual costs such as fees, commissions and other charges have not been taken into consideration and would have a negative impact on the performance if they were included.

2) A more appealing yield-duration trade-off

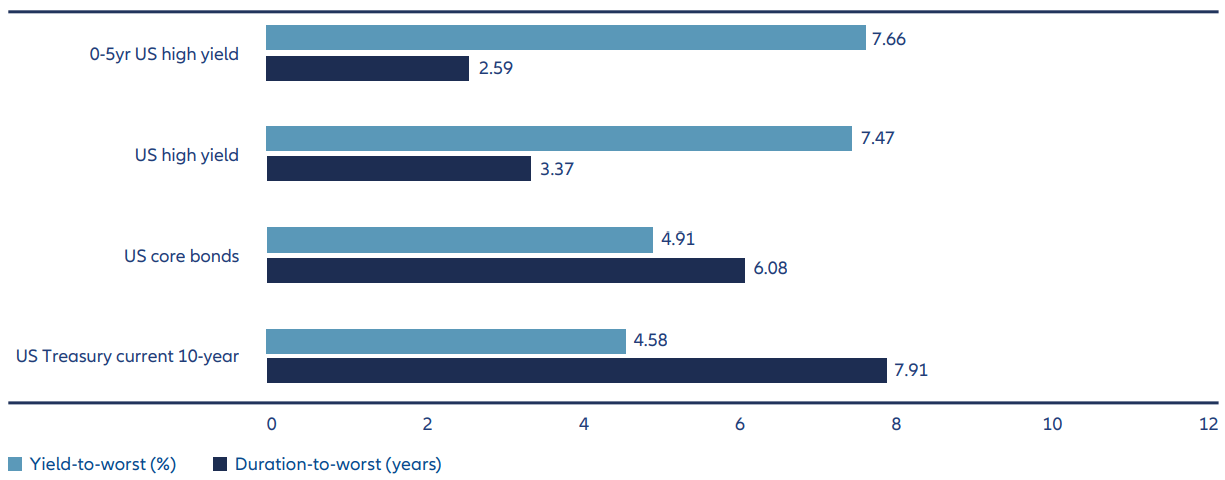
Put simply, yield-duration measures how far a bond’s price would have to fall before wiping out its yield, resulting in a capital loss (this is often called the “breakeven point”). Today’s elevated yields thus provide a cushion against potential price falls in US high yield if recession fears re-emerge.

This is particularly true for the short end of US high yield, where record-high new issuance and refinancing activity in 2020 and 2021 pushed coupons and interest expense down and maturities out (see Exhibit 4).

Exhibit 4: Short maturity HY has greatest yield relative to duration

Data: November 2009 to December 2023. Source: Voya Investment Management, FactSet, ICE Data Services. Past performance, or any prediction, projection or forecast, is not indicative of future performance. statement reflects performance and characteristics for the time period shown, results over a different time period may have been more or less favourable. The performance shown above is gross and does not reflect the deduction of investment advisory fees. US High Yield Bonds: ICE BofA US High Yield Index, 0-5 Yr US High Yield Bonds: ICE BofA 0-5 Year US High Yield Constrained Index, US Core Bonds: Bloomberg US Aggregate Bond Index, US Treasury Current 10-Year: ICE BofA US Treasury Current 10 Year Index. Investors cannot invest directly in an index. Index returns are presented as net returns, which reflect both price performance and income from dividend payments, if any, but do not reflect fees, brokerage commissions or other expenses of investing. Individual costs such as fees, commissions and other charges have not been taken into consideration and would have a negative impact on the performance if they were included.

Credit selection remains important

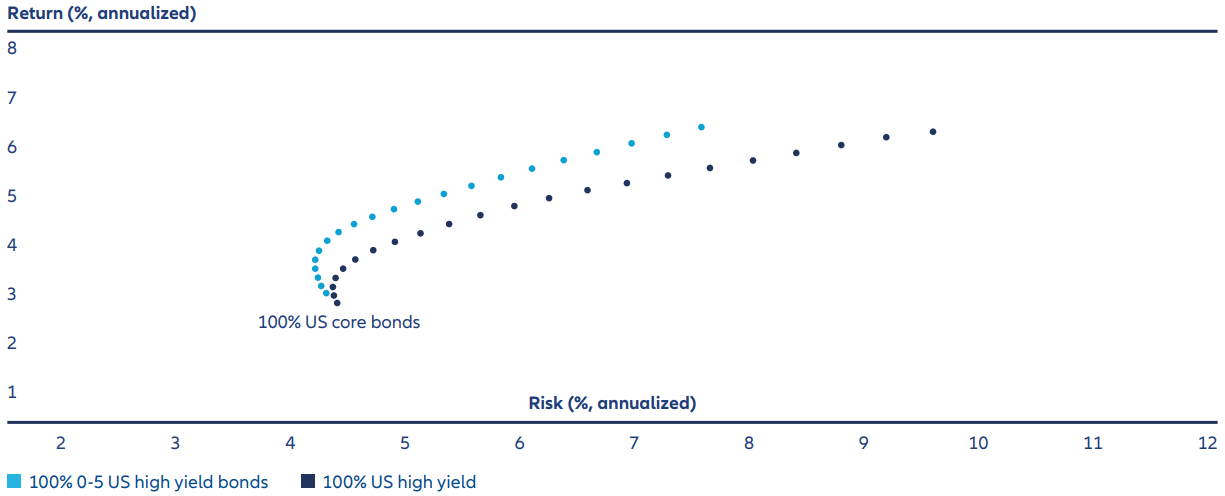
Of course, active management and credit selection remains an important factor. The risks in high yield can vary significantly by credit rating, with a significant step-up in risk having been observed in past cycles where bonds are rated B- or lower.

After their strong recent performance high yield spreads may struggle to tighten much further in the medium term. But we think today’s elevated yields – especially at shorter maturities – still offer value.

1 Bloomberg, ICE BofA and JP Morgan indices, AllianzGI, 29 December 2023
2 Bloomberg, 29 December 2023. High yield bonds are represented by the ICE BofA US High Yield Index
3 JP Morgan, October 2023
4 JP Morgan, October 2023
5 Bank of America HY Chartbook, data as at 29 December 2023
6 BofA Global Research, ICE Data Indices, July 2023

  • Disclaimer
    An investor cannot invest directly in an index, and index performance does not reflect the deduction of any fees, expenses or taxes. Index comparisons have limitations, as volatility and other characteristics may differ from a particular investment.

    Index definitions: The Bloomberg U.S. Aggregate Index is a broad-based flagship benchmark that measures the investment grade, U.S. dollar-denominated, fixed-rate taxable bond market. The index includes Treasuries, government-related and corporate securities, fixed-rate agency MBS, ABS and CMBS (agency and non-agency). The ICE BofA U.S. Treasury Index series is an unmanaged index that tracks the performance of the direct sovereign debt of the U.S. government with maturities in the ranges indicated. The Bloomberg U.S. Government/Credit 1-3 Year Index covers Treasuries, agencies, publicly issued U.S. corporate and foreign debentures and secured notes that meet specified maturity, liquidity and quality requirements. The ICE BofA U.S. High Yield Index is a market value–weighted index consisting of USD-denominated, non–investment grade bonds not currently in default.

    Allianz Global Investors and Voya Investment Management (Voya IM) have entered into a long-term strategic partnership, and as such, as of 25 July 2022, the investment team transferred to Voya IM and Voya IM became the delegated manager for certain strategies. AllianzGI continues to provide information and services to Voya IM for this purpose through a transitional service agreement.

    Investing involves risk. The value of an investment and the income from it will fluctuate and investors may not get back the principal invested. Past performance is not indicative of future performance. This is a marketing communication. It is for informational purposes only. This document does not constitute investment advice or a recommendation to buy, sell or hold any security and shall not be deemed an offer to sell or a solicitation of an offer to buy any security.

    The views and opinions expressed herein, which are subject to change without notice, are those of the issuer or its affiliated companies at the time of publication. Certain data used are derived from various sources believed to be reliable, but the accuracy or completeness of the data is not guaranteed and no liability is assumed for any direct or consequential losses arising from their use. The duplication, publication, extraction or transmission of the contents, irrespective of the form, is not permitted. This material has not been reviewed by any regulatory authorities. In mainland China, it is for Qualified Domestic Institutional Investors scheme pursuant to applicable rules and regulations and is for information purpose only. This document does not constitute a public offer by virtue of Act Number 26.831 of the Argentine Republic and General Resolution No. 622/2013 of the NSC. This communication’s sole purpose is to inform and does not under any circumstance constitute promotion or publicity of Allianz Global Investors products and/or services in Colombia or to Colombian residents pursuant to part 4 of Decree 2555 of 2010. This communication does not in any way aim to directly or indirectly initiate the purchase of a product or the provision of a service offered by Allianz Global Investors. Via reception of his document, each resident in Colombia acknowledges and accepts to have contacted Allianz Global Investors via their own initiative and that the communication under no circumstances does not arise from any promotional or marketing activities carried out by Allianz Global Investors. Colombian residents accept that accessing any type of social network page of Allianz Global Investors is done under their own responsibility and initiative and are aware that they may access specific information on the products and services of Allianz Global Investors. This communication is strictly private and confidential and may not be reproduced, except for the case of explicit permission by Allianz Global Investors. This communication does not constitute a public offer of securities in Colombia pursuant to the public offer regulation set forth in Decree 2555 of 2010. This communication and the information provided herein should not be considered a solicitation or an offer by Allianz Global Investors or its affiliates to provide any financial products in Brazil, Panama, Peru, and Uruguay. In Australia, this material is presented by Allianz Global Investors Asia Pacific Limited (“AllianzGI AP”) and is intended for the use of investment consultants and other institutional /professional investors only, and is not directed to the public or individual retail investors. AllianzGI AP is not licensed to provide financial services to retail clients in Australia. AllianzGI AP is exempt from the requirement to hold an Australian Foreign Financial Service License under the Corporations Act 2001 (Cth) pursuant to ASIC Class Order (CO 03/1103) with respect to the provision of financial services to wholesale clients only. AllianzGI AP is licensed and regulated by Hong Kong Securities and Futures Commission under Hong Kong laws, which differ from Australian laws.

    This document is being distributed by the following Allianz Global Investors companies: Allianz Global Investors GmbH, an investment company in Germany, authorized by the German Bundesanstalt für Finanzdienstleistungsaufsicht (BaFin); Allianz Global Investors (Schweiz) AG; Allianz Global Investors UK Limited, authorized and regulated by the Financial Conduct Authority; in HK, by Allianz Global Investors Asia Pacific Ltd., licensed by the Hong Kong Securities and Futures Commission; in Singapore, by Allianz Global Investors Singapore Ltd., regulated by the Monetary Authority of Singapore [Company Registration No. 199907169Z]; in Japan, by Allianz Global Investors Japan Co., Ltd., registered in Japan as a Financial Instruments Business Operator [Registered No. The Director of Kanto Local Finance Bureau (Financial Instruments Business Operator), No. 424], Member of Japan Investment Advisers Association, the Investment Trust Association, Japan and Type II Financial Instruments Firms Association; in Taiwan, by Allianz Global Investors Taiwan Ltd., licensed by Financial Supervisory Commission in Taiwan; and in Indonesia, by PT. Allianz Global Investors Asset Management Indonesia licensed by Indonesia Financial Services Authority (OJK).

    AdMaster: 3340734

Recent insights

Navigating Rates

Markets are now pricing in only one or two 25bp cuts from the Fed in 2024, down from six or seven back in January, while a June rate cut from the ECB is also not guaranteed.

Discover more

Embracing Disruption

India’s economic growth over the past decade has been impressive. In 2023, India contributed 17.6% to global GDP growth.

Discover more

Navigating Rates

Iran’s direct action on Israel over the weekend has led to fears of further escalation. But in the absence of a full-blown crisis in the region – which is not our base case – we think the impact on financial markets will be contained.

Discover more

Allianz Global Investors

You are leaving this website and being re-directed to the below website. This does not imply any approval or endorsement of the information by Allianz Global Investors Asia Pacific Limited contained in the redirected website nor does Allianz Global Investors Asia Pacific Limited accept any responsibility or liability in connection with this hyperlink and the information contained herein. Please keep in mind that the redirected website may contain funds and strategies not authorized for offering to the public in your jurisdiction. Besides, please also take note on the redirected website’s terms and conditions, privacy and security policies, or other legal information. By clicking “Continue”, you confirm you acknowledge the details mentioned above and would like to continue accessing the redirected website. Please click “Stay here” if you have any concerns.