

Navigating Rates
Emerging market debt: lessons learned over 30 years


A large and diverse asset class comprising countries with improved policymaking and stronger institutions merits a reassessment.
Key takeaways
- Since its inception in the early 1990s with Brady bonds, the emerging market debt (EMD) asset class has expanded in size, scope and country participation – growing from just eight to over 70 countries. The currency composition of EM debt has shifted from predominantly US dollar-denominated to mostly local currency, reflecting EM countries’ improved fiscal discipline and resilience.
- It is a common misconception among investors that if a bond is labelled “EM” then the investment risks are high. Emerging markets have seen substantial progress in macroeconomic policy, institutional strength and ESG practices, with independent central banks and fiscal rules enhancing stability.
- Managing EMD portfolios involves identifying a country’s “direction of travel”, which is the underlying trajectory of its economic, political and policy environment. An index-driven approach is not appropriate for EMD given the huge opportunity set and flaws in the way indexes are complied.
Since I started my emerging market debt (EMD) journey in 1993, the asset class has grown significantly in terms of absolute size and the number of countries with investible debt markets. EMD has its origins in the early 1990s following the restructuring of defaulted sovereign bank loans into tradable hard currency (US dollar) bonds known as Brady bonds. When the first EMD indexes were created there were just eight countries represented; now, there are over 70.
The changing currency composition of the EMD asset class has helped reduce risks. The Tequila (1994) and Asia (1998) crises negatively impacted those EM countries with largely US dollar-denominated debt whose currencies were pegged to the dollar – they showed that relying on USD-denominated debt issuance to finance ever increasing current account deficits was unsustainable, particularly during episodes of rising US policy rates. The ensuing need for fiscal restraint, leading to economic hardship and in some cases default, influenced a shift in the asset class’s currency composition. EMD, which started as a predominantly US dollar bond market, is now predominantly denominated in local currency.
Exhibit 1: Total emerging market debt outstanding (USD trillions)
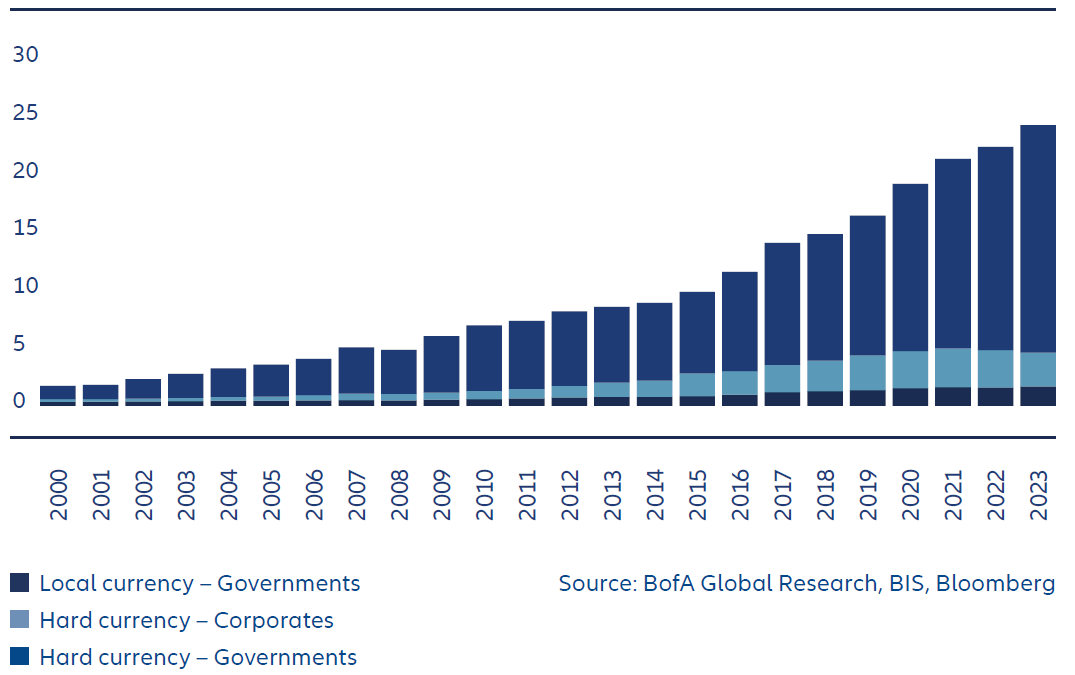
Source: BofA Global Research, BIS, Bloomberg
EMs have made great progress in policymaking and ESG
The crises of the 1990s prompted major reforms in emerging markets, including the adoption of floating exchange rates, independent central banks and stronger FX reserve buffers – significantly improving sovereign balance sheet resilience. Over the past three decades, fiscal policy has become more disciplined, with many countries enshrining fiscal rules in their constitutions to ensure long-term stability. Resource-rich nations have established sovereign wealth funds to manage commodity revenues, helping to smooth economic cycles. These improvements have occurred as many developed markets experienced fiscal slippage.
As a result, emerging markets now often boast stronger growth, lower deficits and improving debt-to-GDP ratios – factors that support lower risk premiums relative to developed markets (see Exhibits 2 and 3). There has also been a steady improvement in environmental, social and governance (ESG) indicators. Governance, in particular, has improved significantly, with more checks and balances and elections that are (mostly) free, allowing for smooth transitions of power. This translates into better economic and social outcomes and lower risk premiums.
Exhibit 2: EMs outpace developed markets (DMs) in fiscal balance
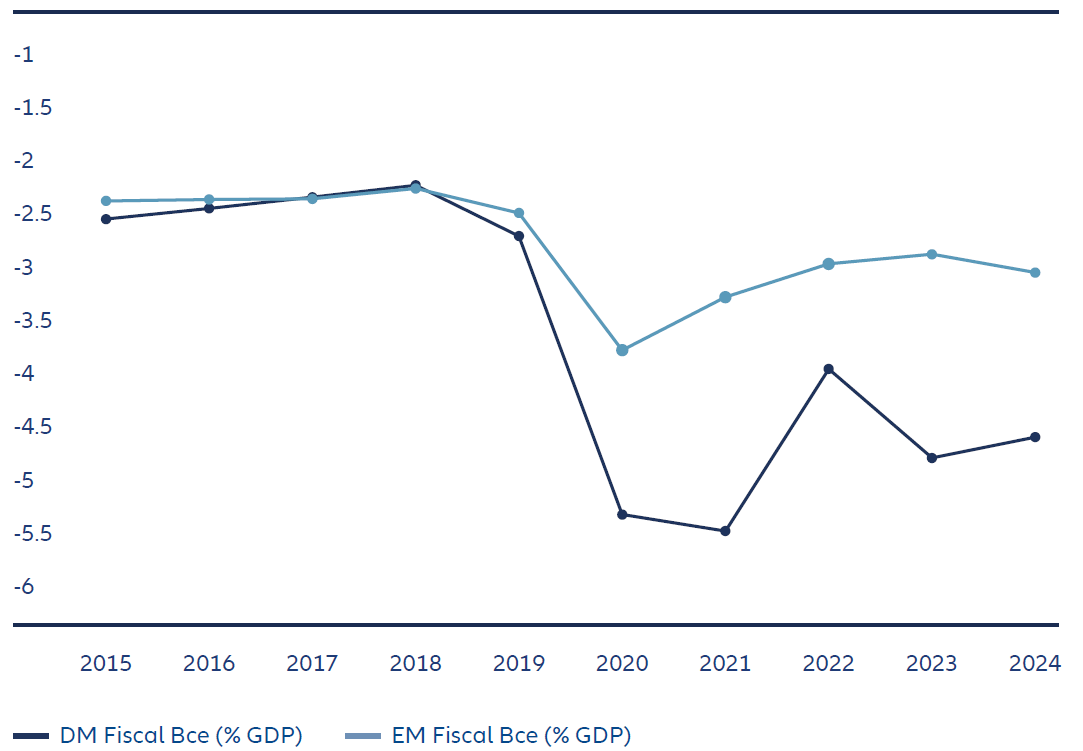
Source: World Economic Outlook data using JP Morgan EMBIG index weights for emerging market averages and a simple average for developed markets of US, UK, eurozone and Japan.
Exhibit 3: EMs have lower debt-to-GDP than DMs

Source: World Economic Outlook data using JP Morgan EMBIG index weights for emerging market averages and a simple average for developed markets of US, UK, eurozone and Japan.
EMD assets have performed well despite mutual fund outflows
Coinciding with these positive macro policy changes came the development of local financial institutions. Pension funds were created, both private and public. Banking sectors grew to support fast-growing countries. Pension fund and bank sector assets have created the investor base for debt issued in domestic currencies while fostering the growth of domestic debt markets. What started as an asset class dominated by non-resident, foreign investors trading US dollar bonds is now dominated by local investors owning their own market.
Local investors also own ever larger amounts of US dollar-denominated debt. Some countries, primarily commodity exporters, are highly dollarised, so have USD liquidity that needs to find a home. Large institutions from around the world have also increased exposure to EMD.
It is well documented that there have been mostly outflows from EMD mutual funds in recent years. Despite this, EM assets have performed well – these other non-mutual fund investors have more than compensated for outflows from traditional EMD mutual funds. (see Exhibit 4).
Exhibit 4: While mutual funds withdraw from the market, other buyers have pushed up returns
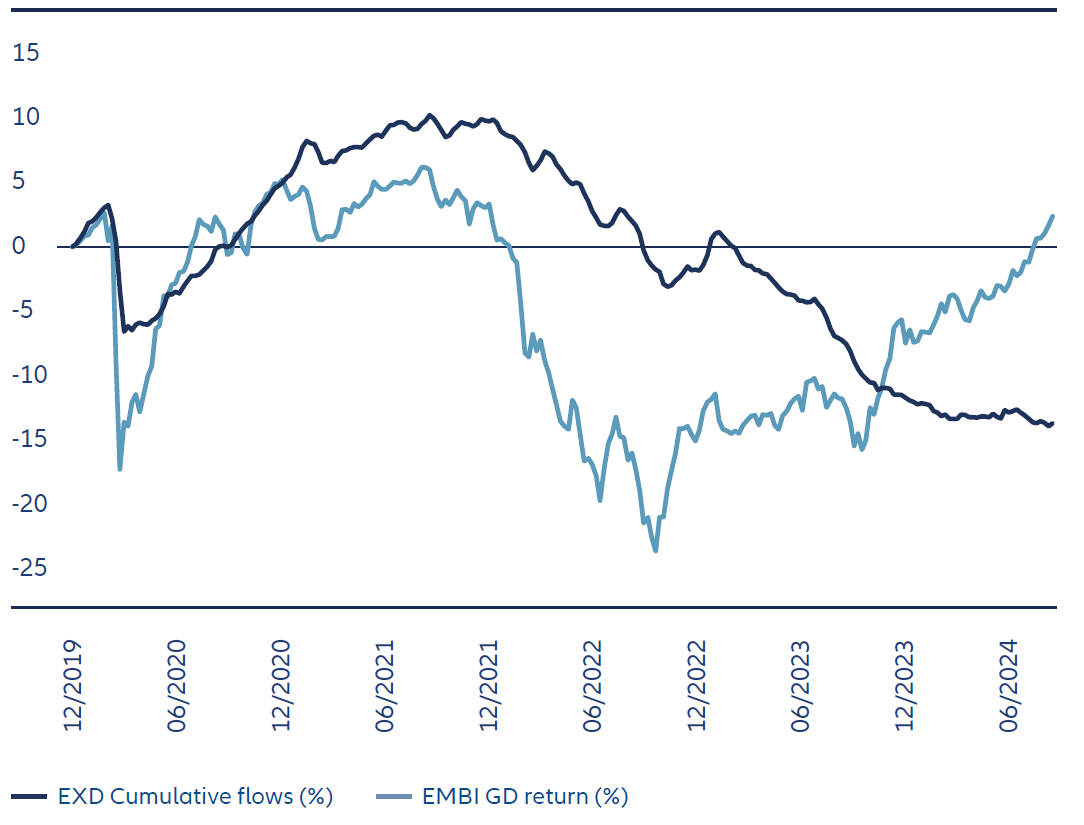
Source: BofA Global Research/EPFR. External Debt: Cumulative mutual fund flows. Total Return: JPMorgan Emerging Market Global Bond Diversified Index (USD)
EM credit ratings have gone up – unlike developed markets
The improvement in EM creditworthiness has been recognised by rating agencies. Over the past 30 years, the overall credit quality of the asset class has been on an upward trajectory with the past few years seeing many more sovereign upgrades than downgrades (see Exhibit 5). This contrasts with deteriorating trends in developed markets due to rising debt and policy uncertainty.
Exhibit 5: EM credit ratings are improving
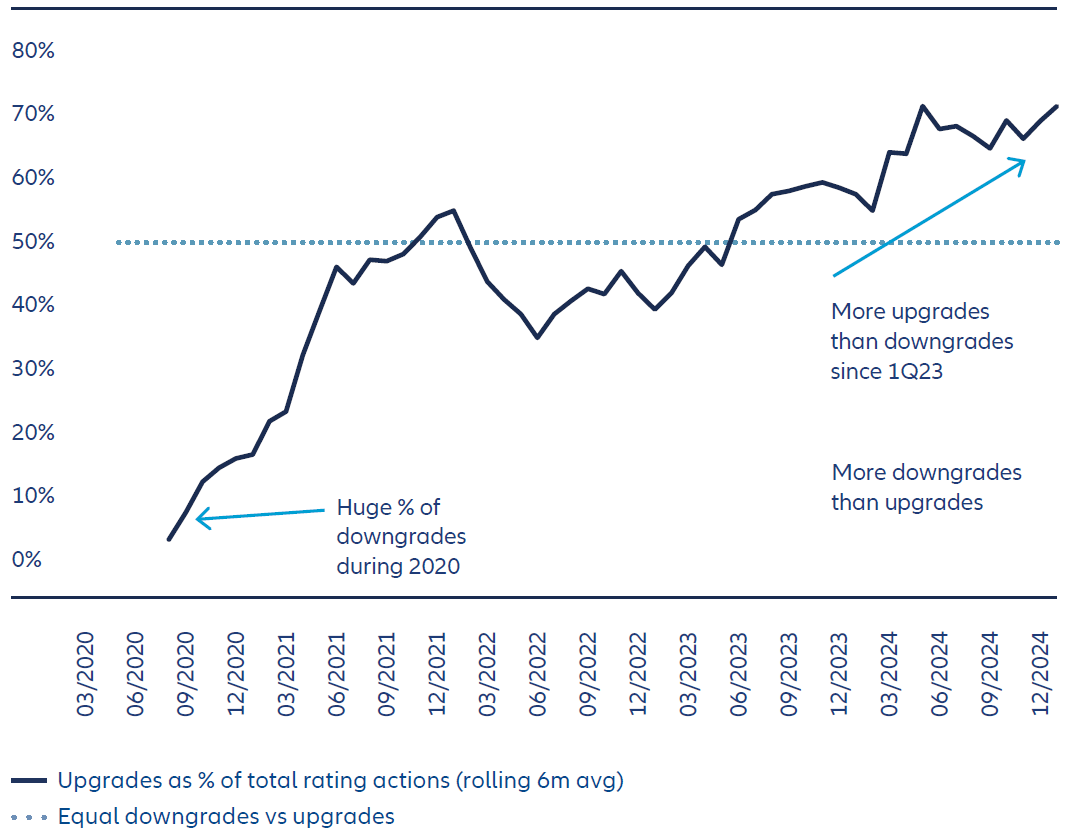
Source: BofA Global Research, Bloomberg. Suriname, Belize, Ecuador and Argentina were upgraded after restructurings of debt.
A reassessment of EMD is long overdue
There is a common misconception among investors that if a bond is labelled “EM” then the investment risks are high. Indexes have arguably contributed to the negative perception of EMD. A country is included in an index and given the “emerging” label based on a national income measure being below a certain threshold. There is no quality control for index inclusion. Our view is that the small handful of countries in the index that perform poorly tend to dominate headlines and cloud investor perception of the entire asset class. If, instead, the focus was on those index countries whose institutions, governance and policymaking have improved significantly over time, we believe the perception would be very different.
We believe EMD suits a non-index approach
Country classifications have evolved as nations once labelled as emerging have transitioned to developed market status. In some cases, developed markets are exhibiting erratic policymaking and weakened institutional checks and balances. As a result, the distinction between emerging and developed has blurred, reinforcing the importance of forward-looking, fundamentals-based analysis over rigid labels.
I believe consistent alpha generation is achieved by recognising the limits of one’s knowledge and remaining open to new information in a constantly evolving market landscape. Equally vital is sizing positions appropriately – ensuring no single investment can disproportionately impact the portfolio, even when conviction is high. The main lesson was learned at the beginning of my 30-year journey: invest (or not) based on a thorough understanding of what drives a country’s “direction of travel” – a decision to invest being based on a country’s fundamental merit rather than because it happens to be included in an index.
This article was first published on Citywire.


