Global CIO Equity Briefing
Mind the (Recession) Gap

The global economy faces major headwinds. Many earnings estimates have yet to reflect this potential economic deceleration. Yet while markets have become intensely focused on the short-term, select opportunities exist for diversified active managers.
Key takeaways:
- The global economy faces three headwinds – Europe’s energy crisis, sustained inflation and a slowing China.
- Corporate earnings estimates do not currently reflect the speed of this economic deceleration.
- Investors are eager for signs inflation is under control and economic data is no longer worsening.
- Markets are focused on the short-term more than ever and money once again has a cost.
- Actively identifying opportunities requires careful and diversified positioning for the long-term.
The European energy crisis
Energy has been this year’s standout driver of inflation. Europe in particular has been most exposed through its reliance on Russian natural gas. Yet recent months have seen energy prices soften, as markets factor in the prospect of weaker economic growth, impressive Ukrainian advances and high inventories. Government interventions to cap prices have also lessened some of the cost impact for both consumers and businesses.
Even so, in a cold winter, current measures will not avoid the need for some form of either compulsory or voluntary rationing. What’s more, energy prices were already rising in advance of Russia’s invasion. With global oil and gas supplies naturally declining at c. 8% p.a.1 , economies will need to see rapid investment in renewables as well as oil and gas to meet longer-term supply challenges.
Sustained inflation despite tightening monetary policy
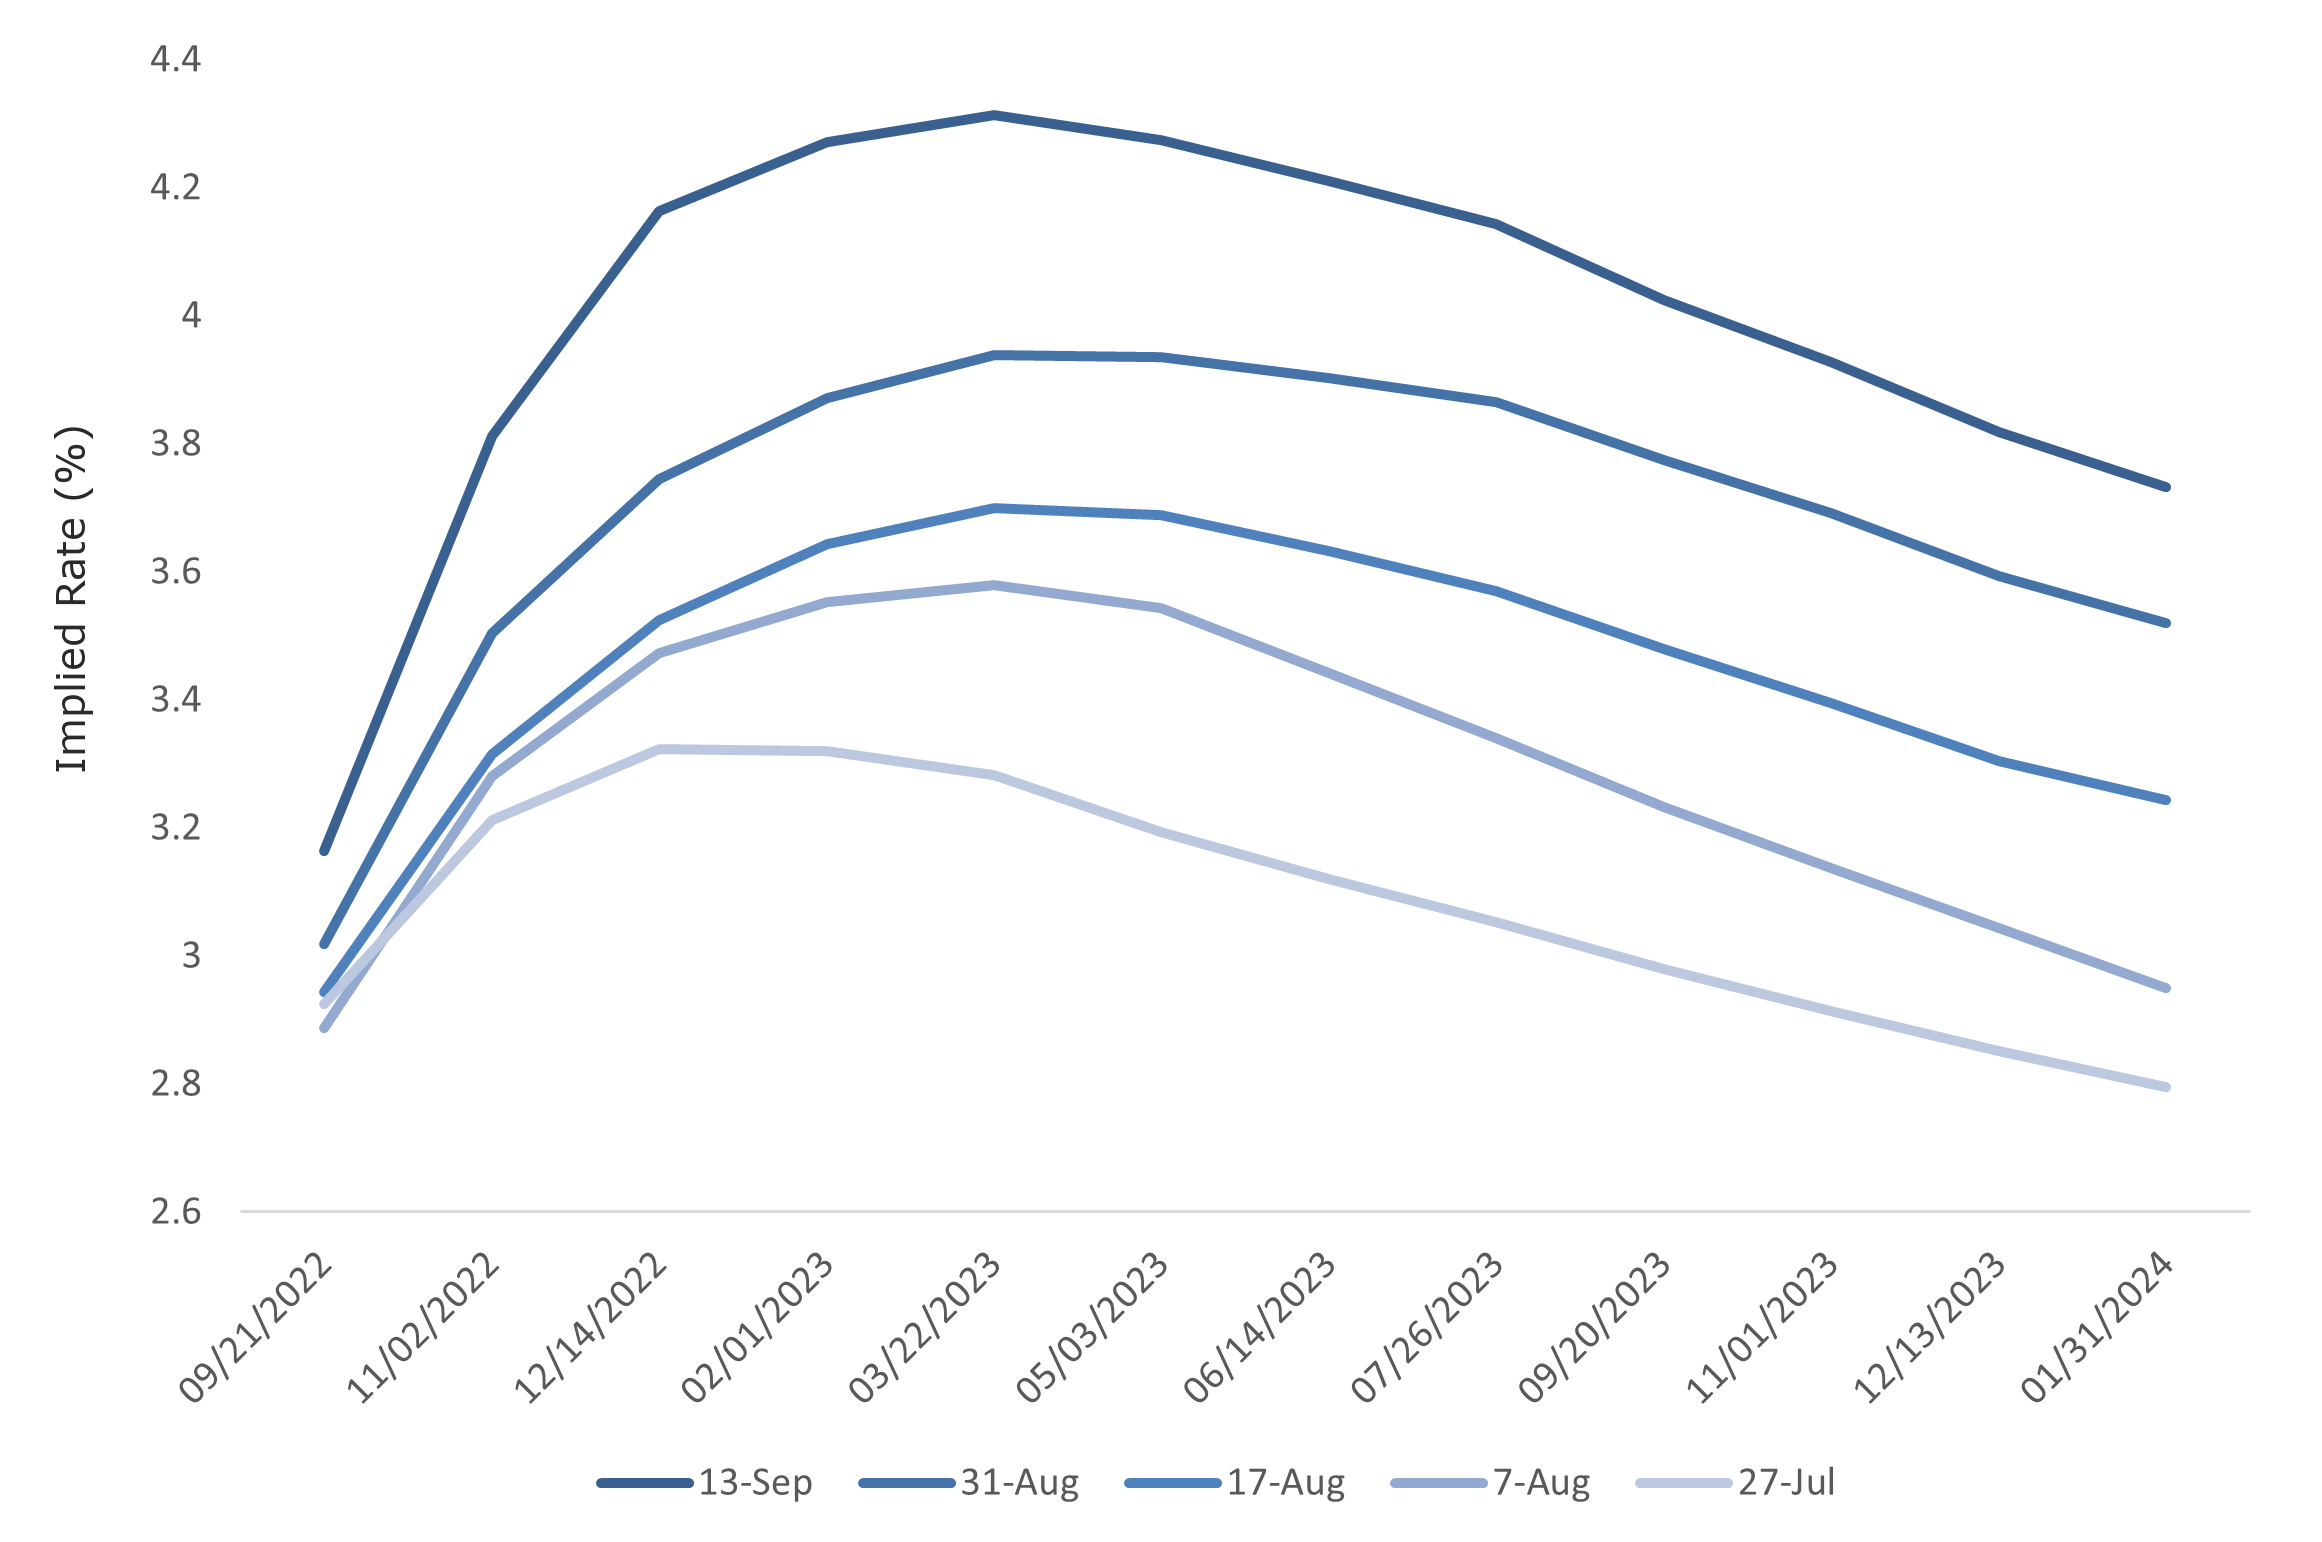
While the US Federal Reserve (Fed) was not the first central bank to raise rates after Covid, it has led the way in terms of the size of its hikes, with far-reaching consequences for global asset valuations. Markets are thus highly focused on continued inflationary pressures. At 8.3%, September’s US Consumer Price Index (CPI) data marked a modest step down from the previous print of 9.1%3 . But with energy, goods and freight prices softening as pandemic supply chain issues ease, labour market and services inflation is increasingly driving upward pricing pressure. This dynamic is starting to embed inflationary expectations, giving the Fed renewed cause to accelerate its firm commitment to tighter monetary policy. Expectations for when the Fed will revert to a more accommodative stance keep being pushed out (Fig.1).
Fig.1 Expectations for US Rate Cuts Keep Being Pushed Out2

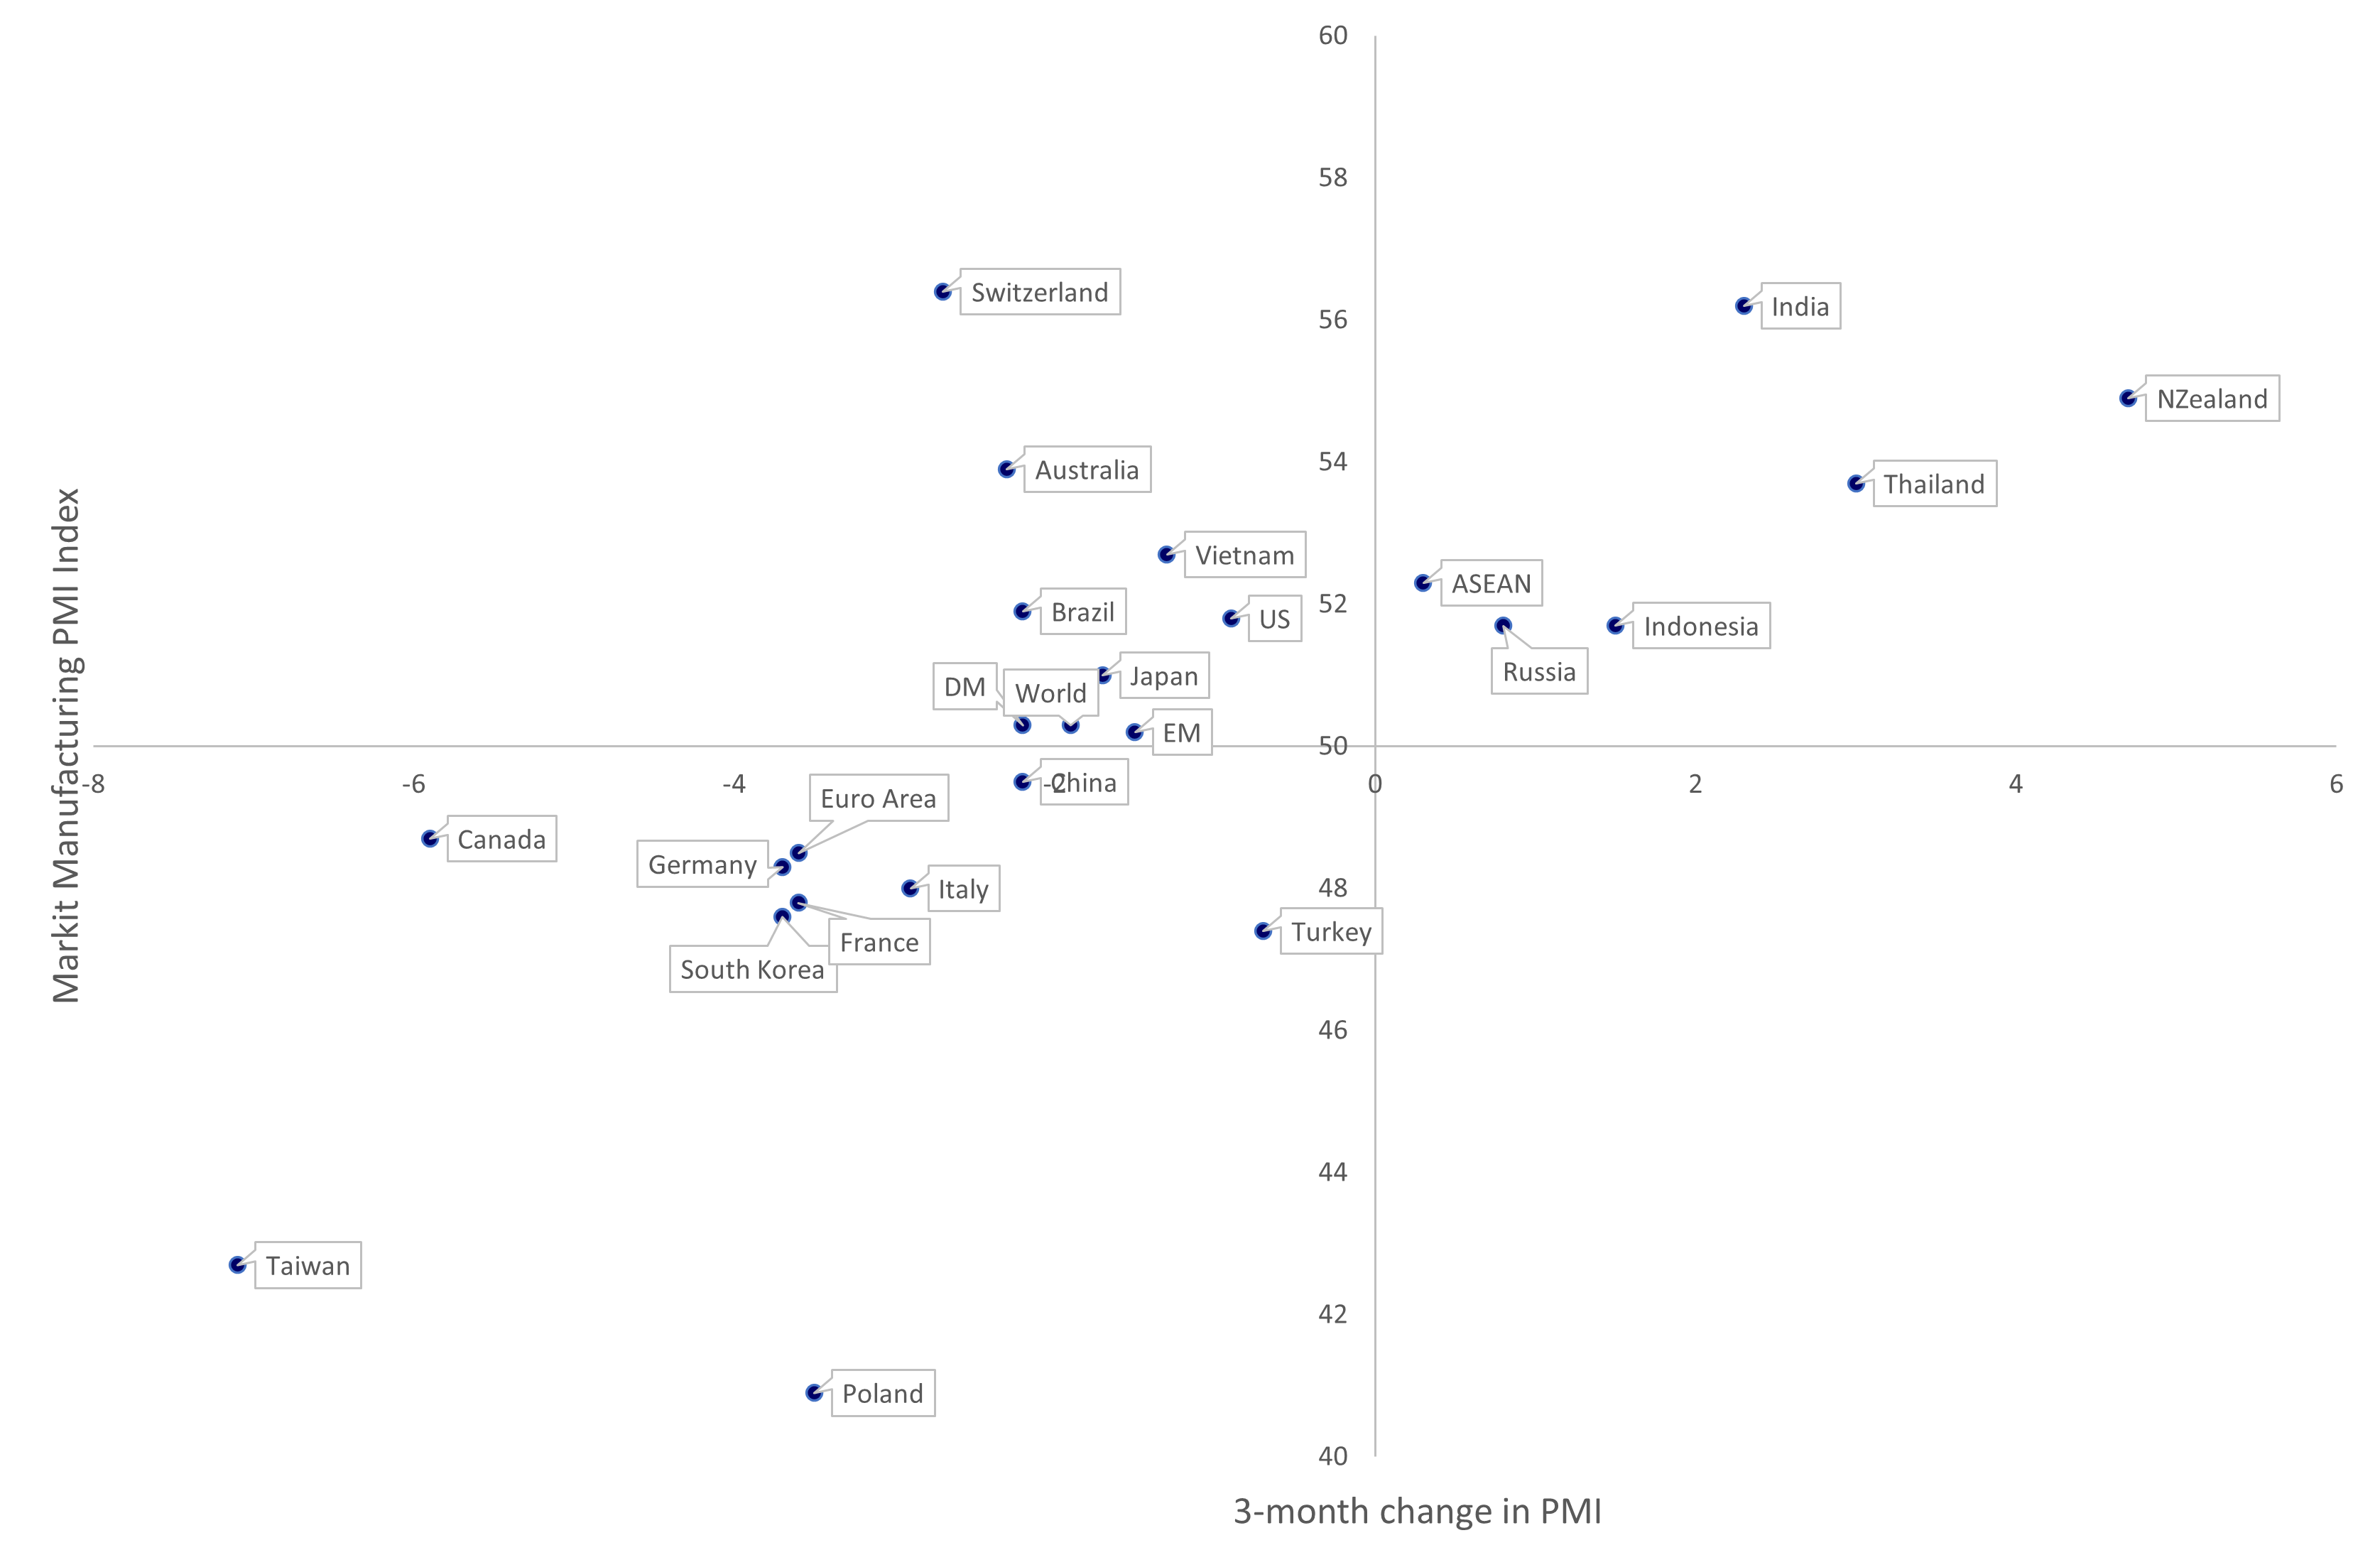
However, there are already some signs the Fed’s measures are taking effect. With mortgage rates now over 6%, the substantial US housing market is likely to slow, softening both the economy and broader sentiment. Industrial production is also starting to slow, with US data falling 0.2% month-on-month in August, and the equivalent EU data dropping 2.4% in July4. Purchasing Manager Index (PMI) numbers are similarly weakening (Fig.2).
Fig.2 Weakening Global Manufacturing5

China’s slowing economy
In previous crises – including the great financial crisis (GFC) – China’s economy has provided the necessary growth to offset broader global weakness. However, policies aligned with President Xi’s stated aims of creating a less unequal society, combined with a “zero Covid” approach have seen this growth weaken. The upcoming National Party Congress (NPC) may be the point at which new measures to stimulate the economy directly are announced.
Even so, the NPC is unlikely to be an immediate game changer for China and equity markets, given the complexity of its political processes. Reshuffling government offices takes around six months to implement, with completion only coming after the “Two Sessions” held in March 2023. As a primarily political event, the NPC will be focused on China’s long-term goals. These in effect serve as lead indicators, and will touch on everything from national security to technological self-sufficiency and decarbonisation. However, it will ultimately lead to more decisive policy implementation once both personnel issues and national priorities are settled.
Valuation and earnings
Earnings estimates do not currently reflect the speed of economic deceleration that monetary tightening, sustained inflation and the resulting destruction of demand are delivering. Summer’s relief rally was supported by relatively good Q2 earnings. These were underpinned by a post-pandemic rebound and some inflationary pricing tailwinds while demand remained strong.
As these factors reverse, analysts must now review margin estimates in light of inventory movements, currencies, commodities, economic slowdown, energy and food shocks, and inflationary pressures. Until we see a realistic revision through an “earnings recession”, this valuation divergence could remain uncorrected. On the positive side, many corporate balance sheets remain in relatively good health, while the global banking system is far more robust than in the GFC.
Interest rate stabilisation
The current drivers of inflation blend geopolitical tensions, both supply and demand side issues, post-Covid rehabilitation and an accelerated shift in the energy ecosystem. Markets are looking for signs that the sharp tightening of monetary policy can be an effective tool to combat these pressures. Meanwhile, investors are looking for both signs that inflation is under control and economic data is no longer worsening.
Assessing unintended consequences
How do we position in this environment?
Markets are currently volatile, pricing securities by extrapolating highly short-term data. At the same time, many investors are facing a world where money has a cost again. This combination requires careful and diversified positioning. From a style perspective, we see reasons to like both Growth and Value stocks selectively, focusing on high-quality names. Companies with robust balance sheets and strong cash flow generation tend to outperform in challenging macroeconomic conditions. With a view to tail risks, we also analyse corporate sustainability as a key component of our quality assessment. Consequently, we are constructive on Growth stocks expanding profitably or Value stocks with a degree of income support.
Diversification is key in challenging times. Many investors may turn to a broad portfolio anchored in factor-based strategies, including low volatility. However, the current environment also creates opportunities from a valuation perspective, particularly around thematic strategies. Such strategies invest in many attractive companies with exposure to longer-term drivers that are uncorrelated from the broader economy – such as artificial intelligence, financial inclusion, cyber security and climate change adaptation. Consequently, they may offer greater growth visibility for investors.
We must therefore assess both the longer-term risks and opportunities from the current disruption. How the world produces and consumes energy will remain a key investment theme, from both an energy transition and a national security perspective. Similarly, the role that China plays as it shifts to Phase 3 of its development will be critical to the global economy for years to come. Finally, the pace at which technology is disrupting every facet of life has not slowed. This so-called Digital Darwinism is generating risks and opportunities across every sector, from healthcare to industrials. It is in this context that we continue to take an active and focused approach.
Equity Indices Performance in USD as of September 30, 2022
|
Data as of September 30, 2022 |
Total Return YTD 2022 (%) |
Total Return August 2022 (%) |
Total Return 3 months(%) |
Total Return 12 months (%) |
|
MSCI All Country World |
-25.34 | -9.53 | -6.71 | -20.29 |
|
MSCI World |
-25.14 | -9.26 | -6.08 | -19.29 |
|
MSCI Emerging Market |
-26.89 | -11.67 | -11.42 | -27.80 |
|
MSCI All Country World Small Cap |
-26.09 | -10.19 | -5.15 | -24.44 |
|
MSCI All Country World Growth |
-32.07 | -10.46 | -5.88 | -27.32 |
|
MSCI World Value |
-18.59 | -8.61 | -7.49 | -13.35 |
|
S&P 500 |
-23.87 | -9.21 | -4.88 | -15.47 |
NASDAQ |
-32.00 | -10.44 | -3.91 | -26.25 |
Stoxx 600 |
-29.55 | -8.87 | -10.31 | -25.60 |
FTSE All Share |
-23.87 | -9.90 | -11.47 | -20.77 |
MSCI Japan |
-26.11 | -10.22 | -7.52 | -29.02 |
MSCI Hong Kong |
-19.39 | -10.71 | -16.97 | -22.25 |
MSCI China A |
-29.72 | -9.62 | -18.96 | -27.31 |
1) https://www.iea.org/reports/the-oil-and-gas-industry-in-energy-transitions
2) Bloomberg as of September 30, 2022. All figures in USD.
3) Bloomberg as of September 30, 2022. All figures in USD.
4) Bloomberg as of September 30, 2022. All figures in USD.
5) IHS Markit as of September 30, 2022.
Please note that this report may be based on manual data uploads and calculations. The methodologies and data sources used may be different from the sources used for official fund documents. This report has been created to the best of our knowledge, effort and available data and is assumed to be correct and reliable at the time of publication. This report has not been externally verified. Please refer to the mandatory periodic statements/reports which are solely binding.


