Equity
Thinking big about Asian small caps

While small cap investing – especially in Asia – is often perceived as volatile, this segment offers unique opportunities for diversification and alpha generation.
Debunking perceptions
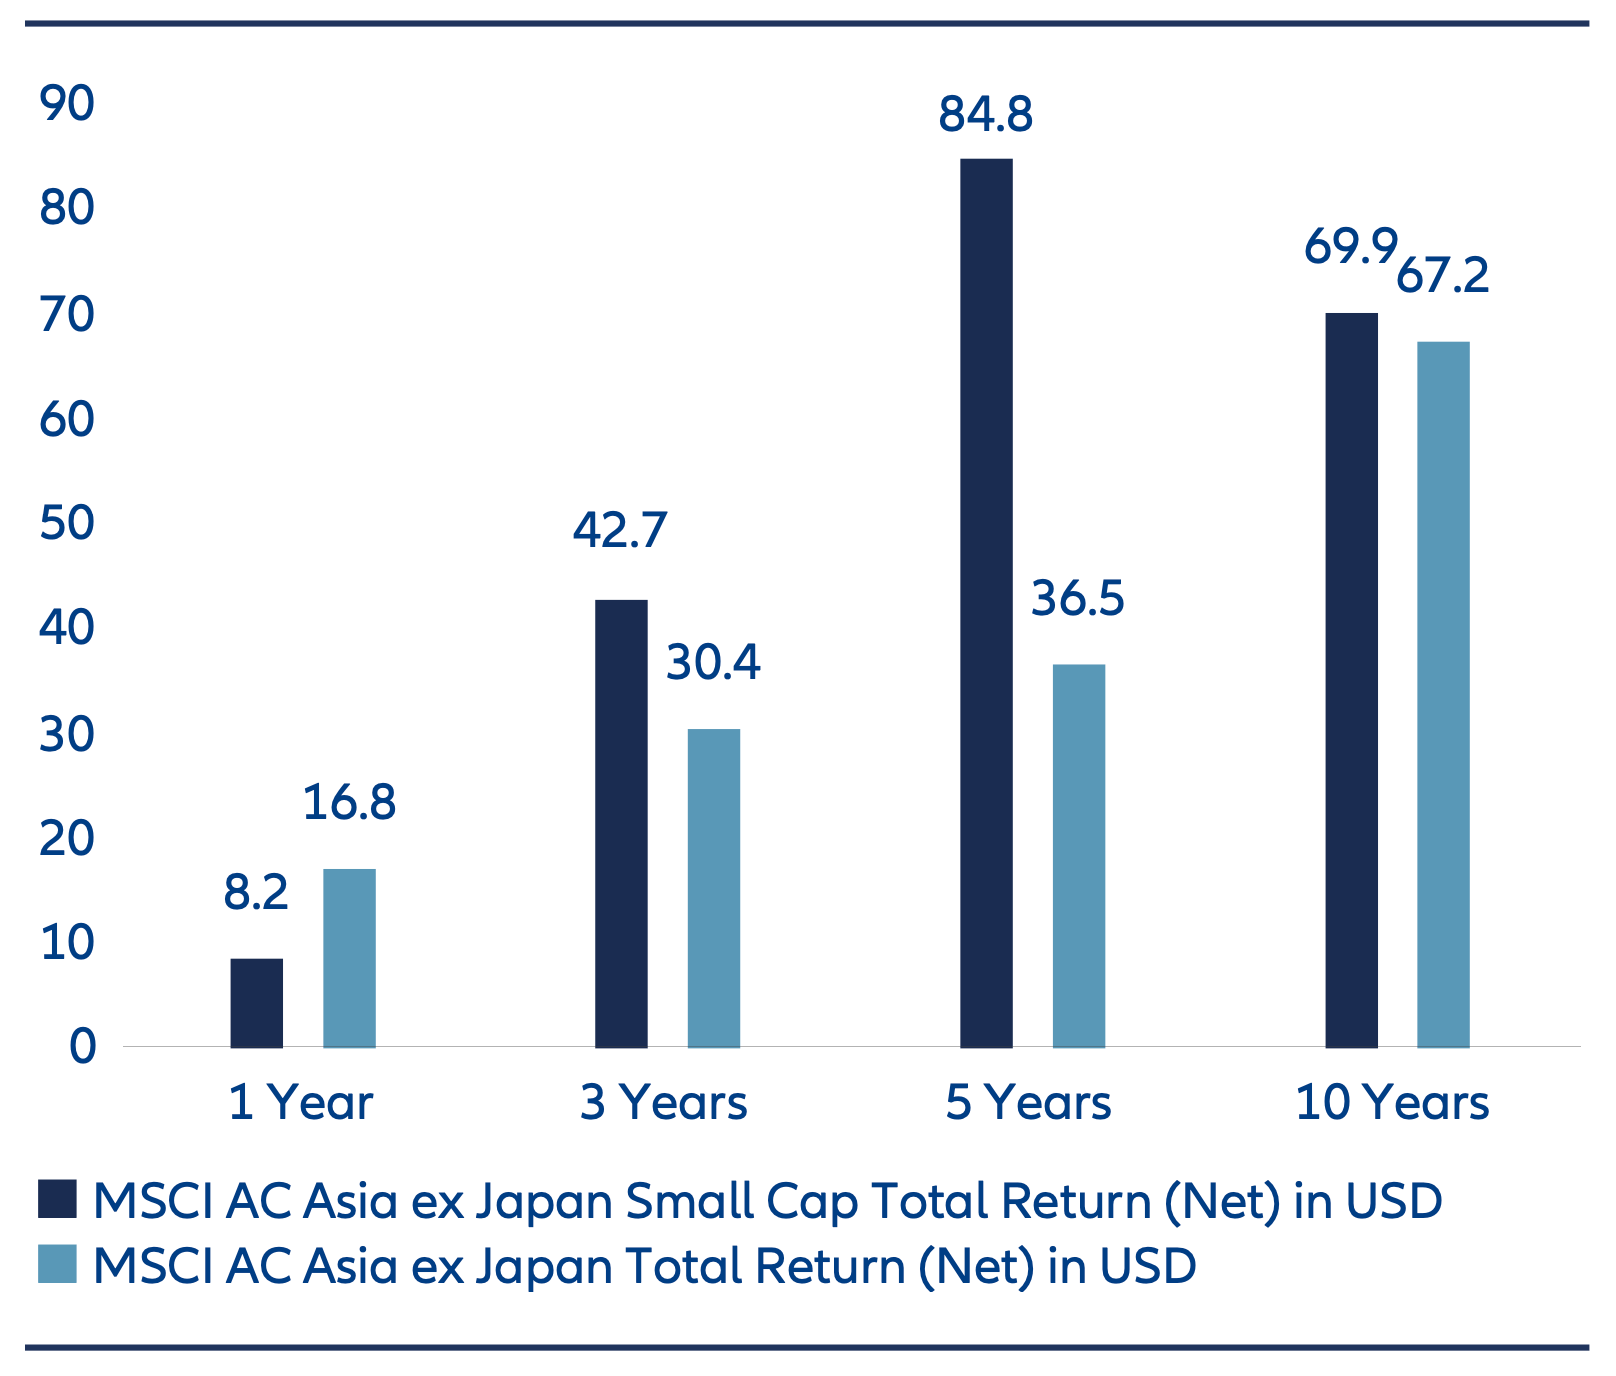
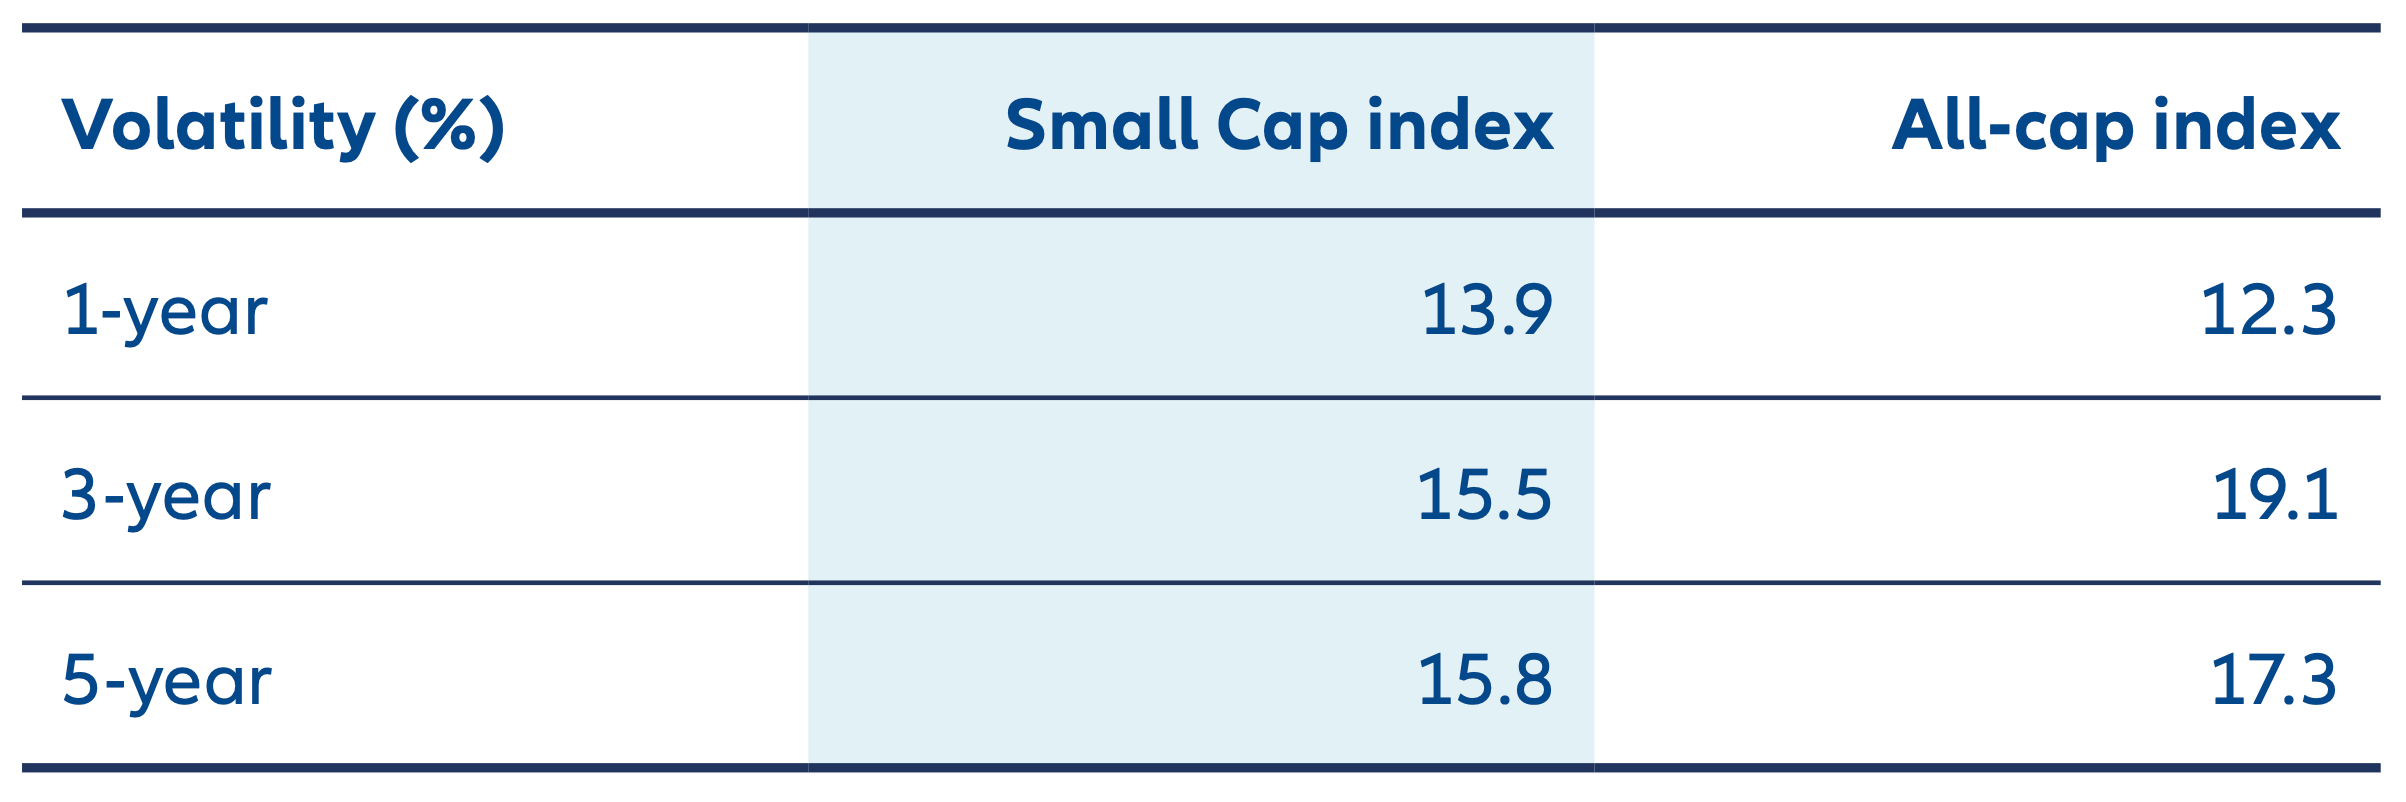
Sensitivity to economic cycles – Investors often perceive small-cap stocks as being more sensitive to economic cycles, which can lead to concerns about underperformance during downturns. Additionally, their smaller size and market presence are commonly associated with higher price volatility. However, these assumptions do not always hold true. In Asia, small-cap equities have actually outperformed the broader market index over the past three, five, and 10 years. Moreover, their volatility has not consistently exceeded that of the broader market, challenging the notion that small caps are inherently riskier (Exhibits 1,2).
Exhibit 1: Cumulative total return of Asian Small Cap compared to broader Asia ex Japan index (%)
Allianz Global Investors, as at 30 June 2025. Volatility is calculated based on monthly returns of respective MSCI indices over the defined period. Market and economic conditions are subject to rapid change, all opinions and views expressed constitute judgments as of the date of the writing and may change at anytime without notice and with no obligation to update. Past performance, or any prediction, projection or forecast, is not indicative of future performance. The information above is provided for reference only, it should not be considered a recommendation to purchase or sell any particular security or strategy or an investment advice.
Exhibit 2: Cumulative total return of Asian Small Cap compared to broader Asia ex Japan index (%)
Allianz Global Investors, as at 30 June 2025. Volatility is calculated based on monthly returns of respective MSCI indices over the defined period. Market and economic conditions are subject to rapid change, all opinions and views expressed constitute judgments as of the date of the writing and may change at anytime without notice and with no obligation to update. Past performance, or any prediction, projection or forecast, is not indicative of future performance. The information above is provided for reference only, it should not be considered a recommendation to purchase or sell any particular security or strategy or an investment advice.
Questionable quality– Controversies occasionally arise around lower quality small cap companies which have gone public. While it is true that some underperformers exist – underscoring the importance of thorough due diligence – the broader small-cap universe, particularly in Asia, tells a different story. This part of the market has less exposure to state owned enterprises, and in particular for Asia, there are a growing number of highly specialized, entrepreneurial businesses that are driving innovation and growth across the region.
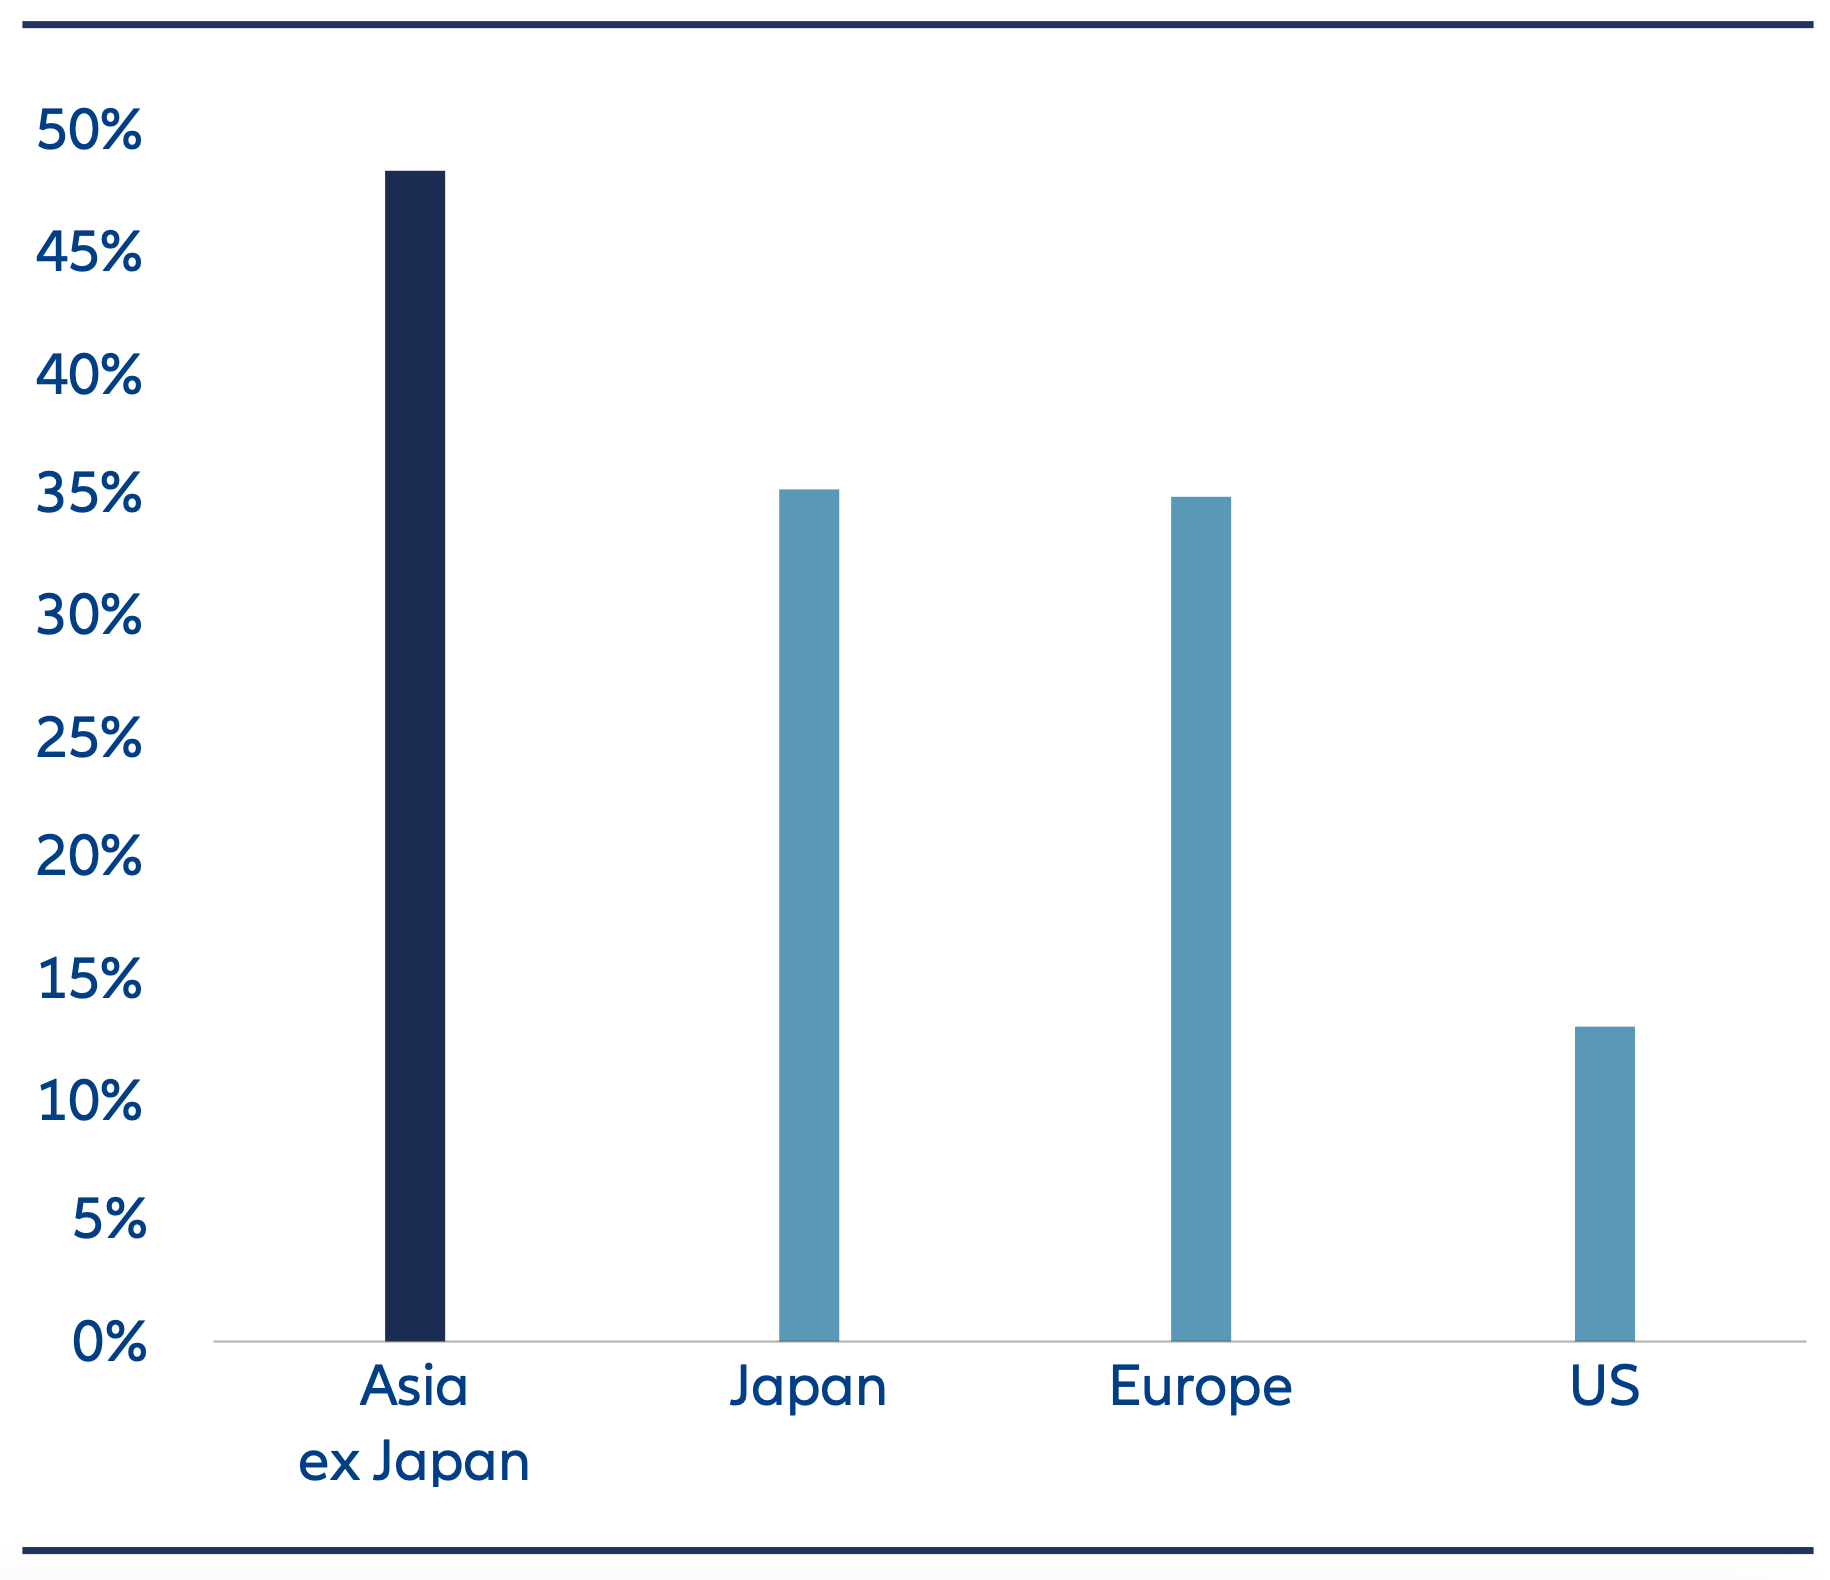
We also find that a greater proportion of small caps in Asia are family-owned and managed compared to their counterparts in Europe and the US (Exhibit 3). This “skin in the game” often translates to closer alignment of interest with minority shareholders, fostering a shared focus on performance, efficiency, and long-term value creation.
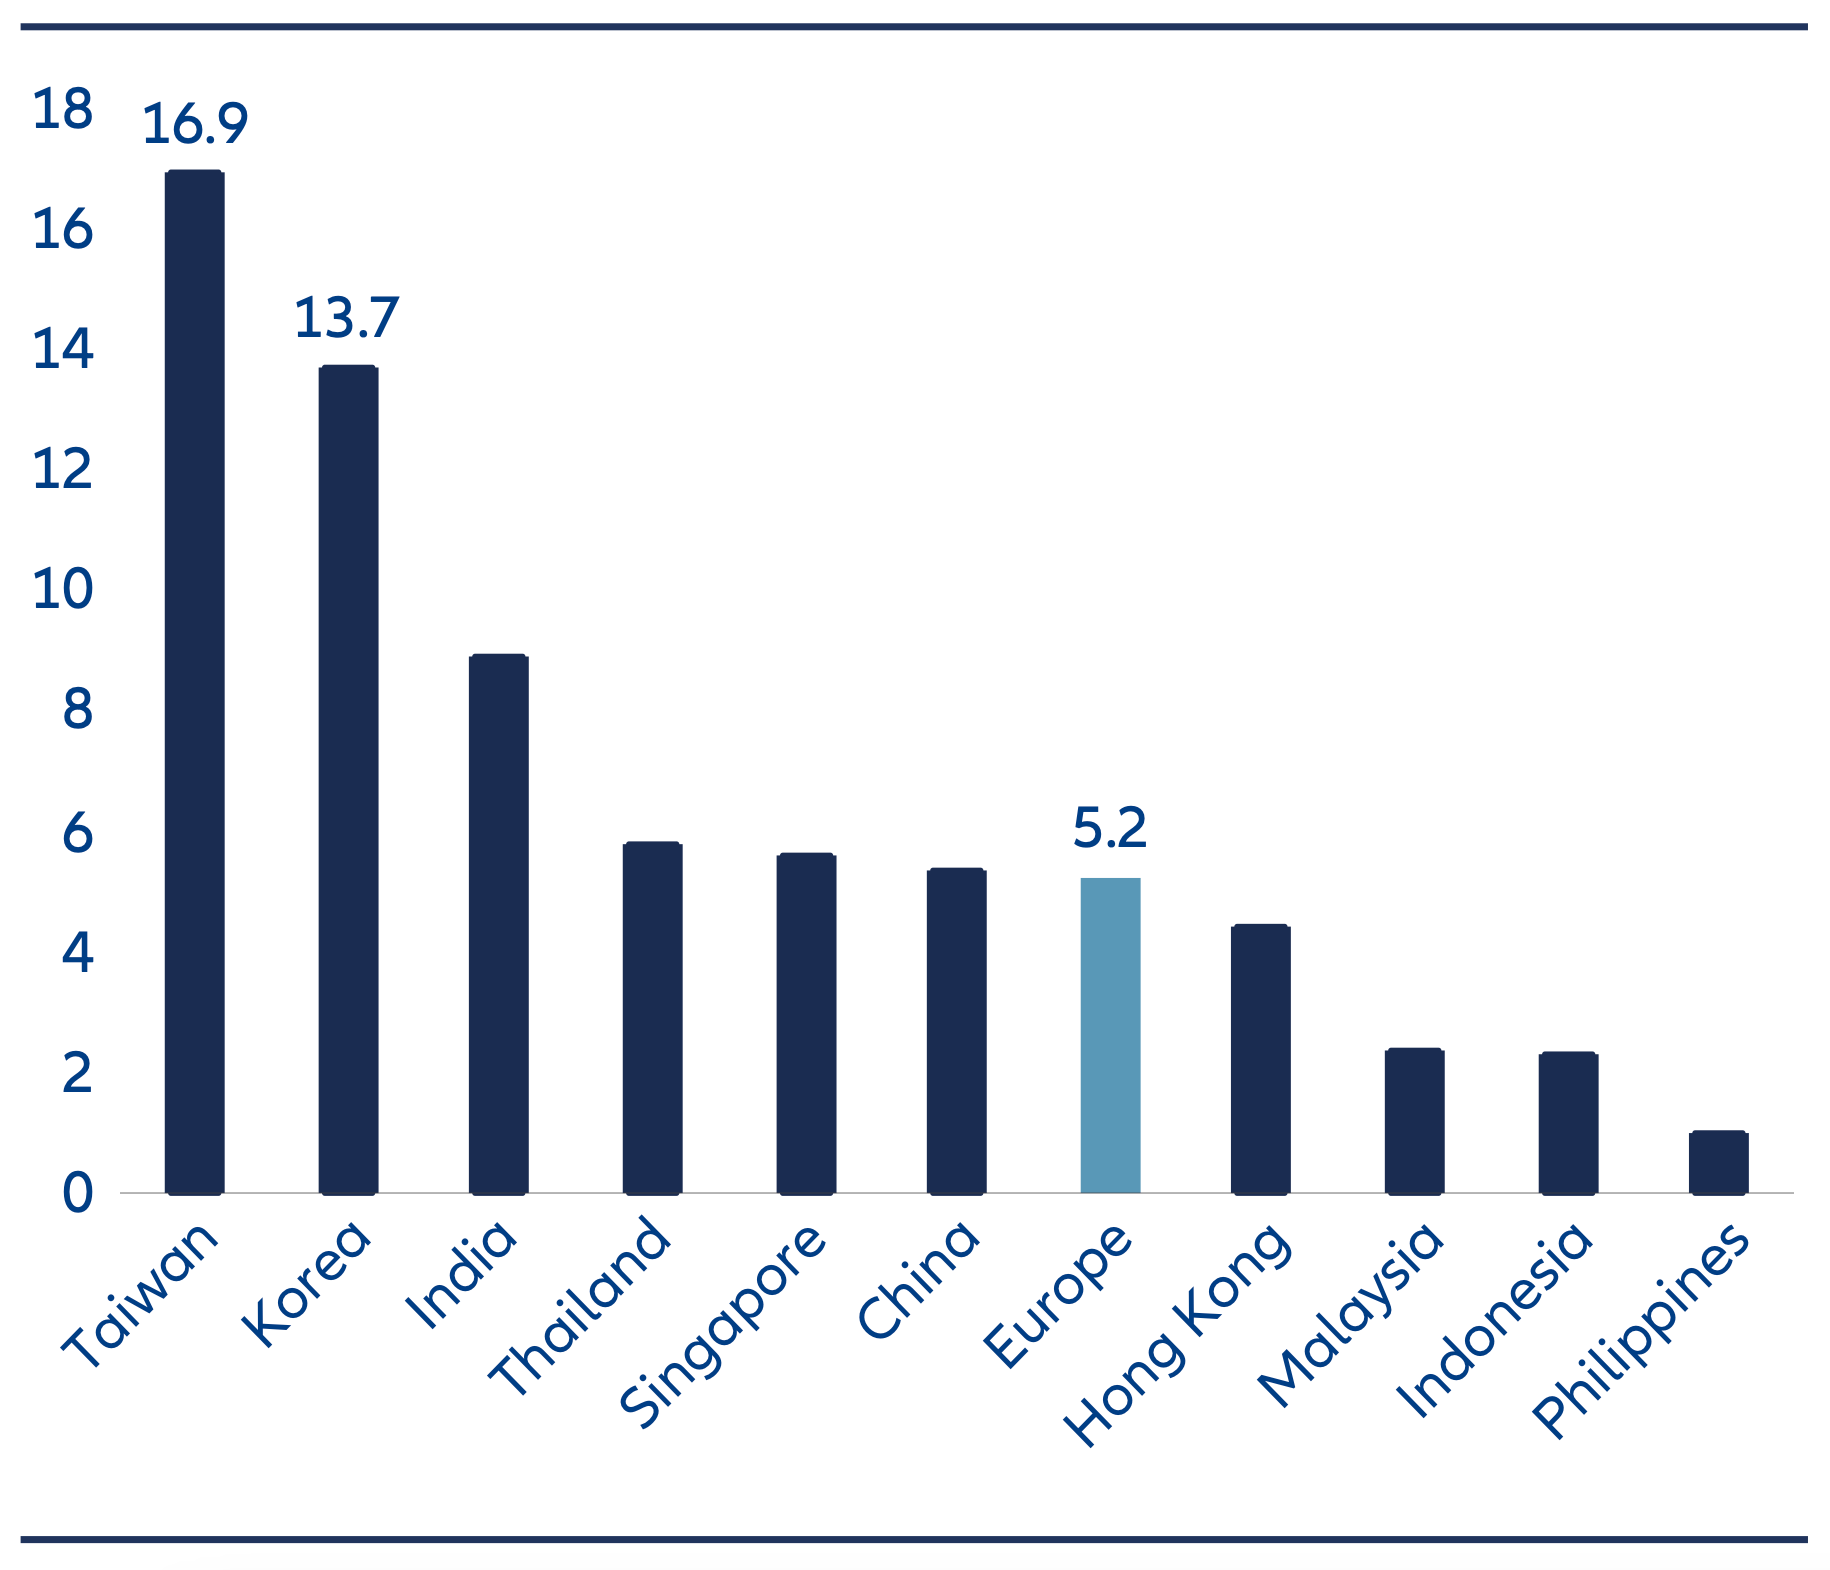
Poor liquidity – It is true that lower market liquidity can make small cap stocks more challenging to trade quickly and in size. However, Asia in general is a highly liquid region. In fact for key markets in the region such as Taiwan and Korea, average daily trading volume of small caps can be more than double that of small caps in Europe (Exhibit 4). While liquidity risk should not be ignored, therefore, it can be effectively managed. And with the right approach, investors can still uncover a wide range of compelling opportunities across the region.
Exhibit 3: Average % of insider/stakeholder holding of mid & small cap companies in different regions
Source: FactSet, Jefferies, as of 10 July 2025. Based on current MSCI ACWI large, mid & small-cap universe. Insider/stakeholder holdings are defined as ownership positions held by non-buy-side entities such as officers, directors, public and private companies, private equity and venture capital firms, and ESOPs.
Exhibit 4: Average daily trading volume of small caps in Asia markets in 2024 compared to Europe (US$m)
Source: FactSet, Jefferies, as of 10 July 2025. Based on current MSCI ACWI large, mid & small-cap universe. Insider/stakeholder holdings are defined as ownership positions held by non-buy-side entities such as officers, directors, public and private companies, private equity and venture capital firms, and ESOPs.
The same applies to sector allocation. While the broader index is dominated by just two sectors— financials and information technology, which together account for nearly half of its weight—the Asian small-cap index demonstrates a more balanced distribution across a wider range of industries (Exhibits 5 and 6). This diversification contributes to more stable performance and mitigates sector-specific volatility.
What can Asian Small Caps do for your portfolios
Diversified exposure to Asia’s growth potential– One key reason Asian small caps may not exhibit higher volatility than the broader index is their more diversified exposure across both geographies and sectors. Unlike indices that are heavily concentrated in specific markets, Asian small caps offer access not only to China but also to other dynamic economies such as Taiwan and India. This geographic spread helps reduce concentration risk.
The same applies to sector allocation. While the broader index is dominated by just two sectors— financials and information technology, which together account for nearly half of its weight—the Asian small-cap index demonstrates a more balanced distribution across a wider range of industries (Exhibits 5 and 6). This diversification contributes to more stable performance and mitigates sector-specific volatility.
Exhibit 5: Geographical breakdown – Asian Small Cap vs All Cap
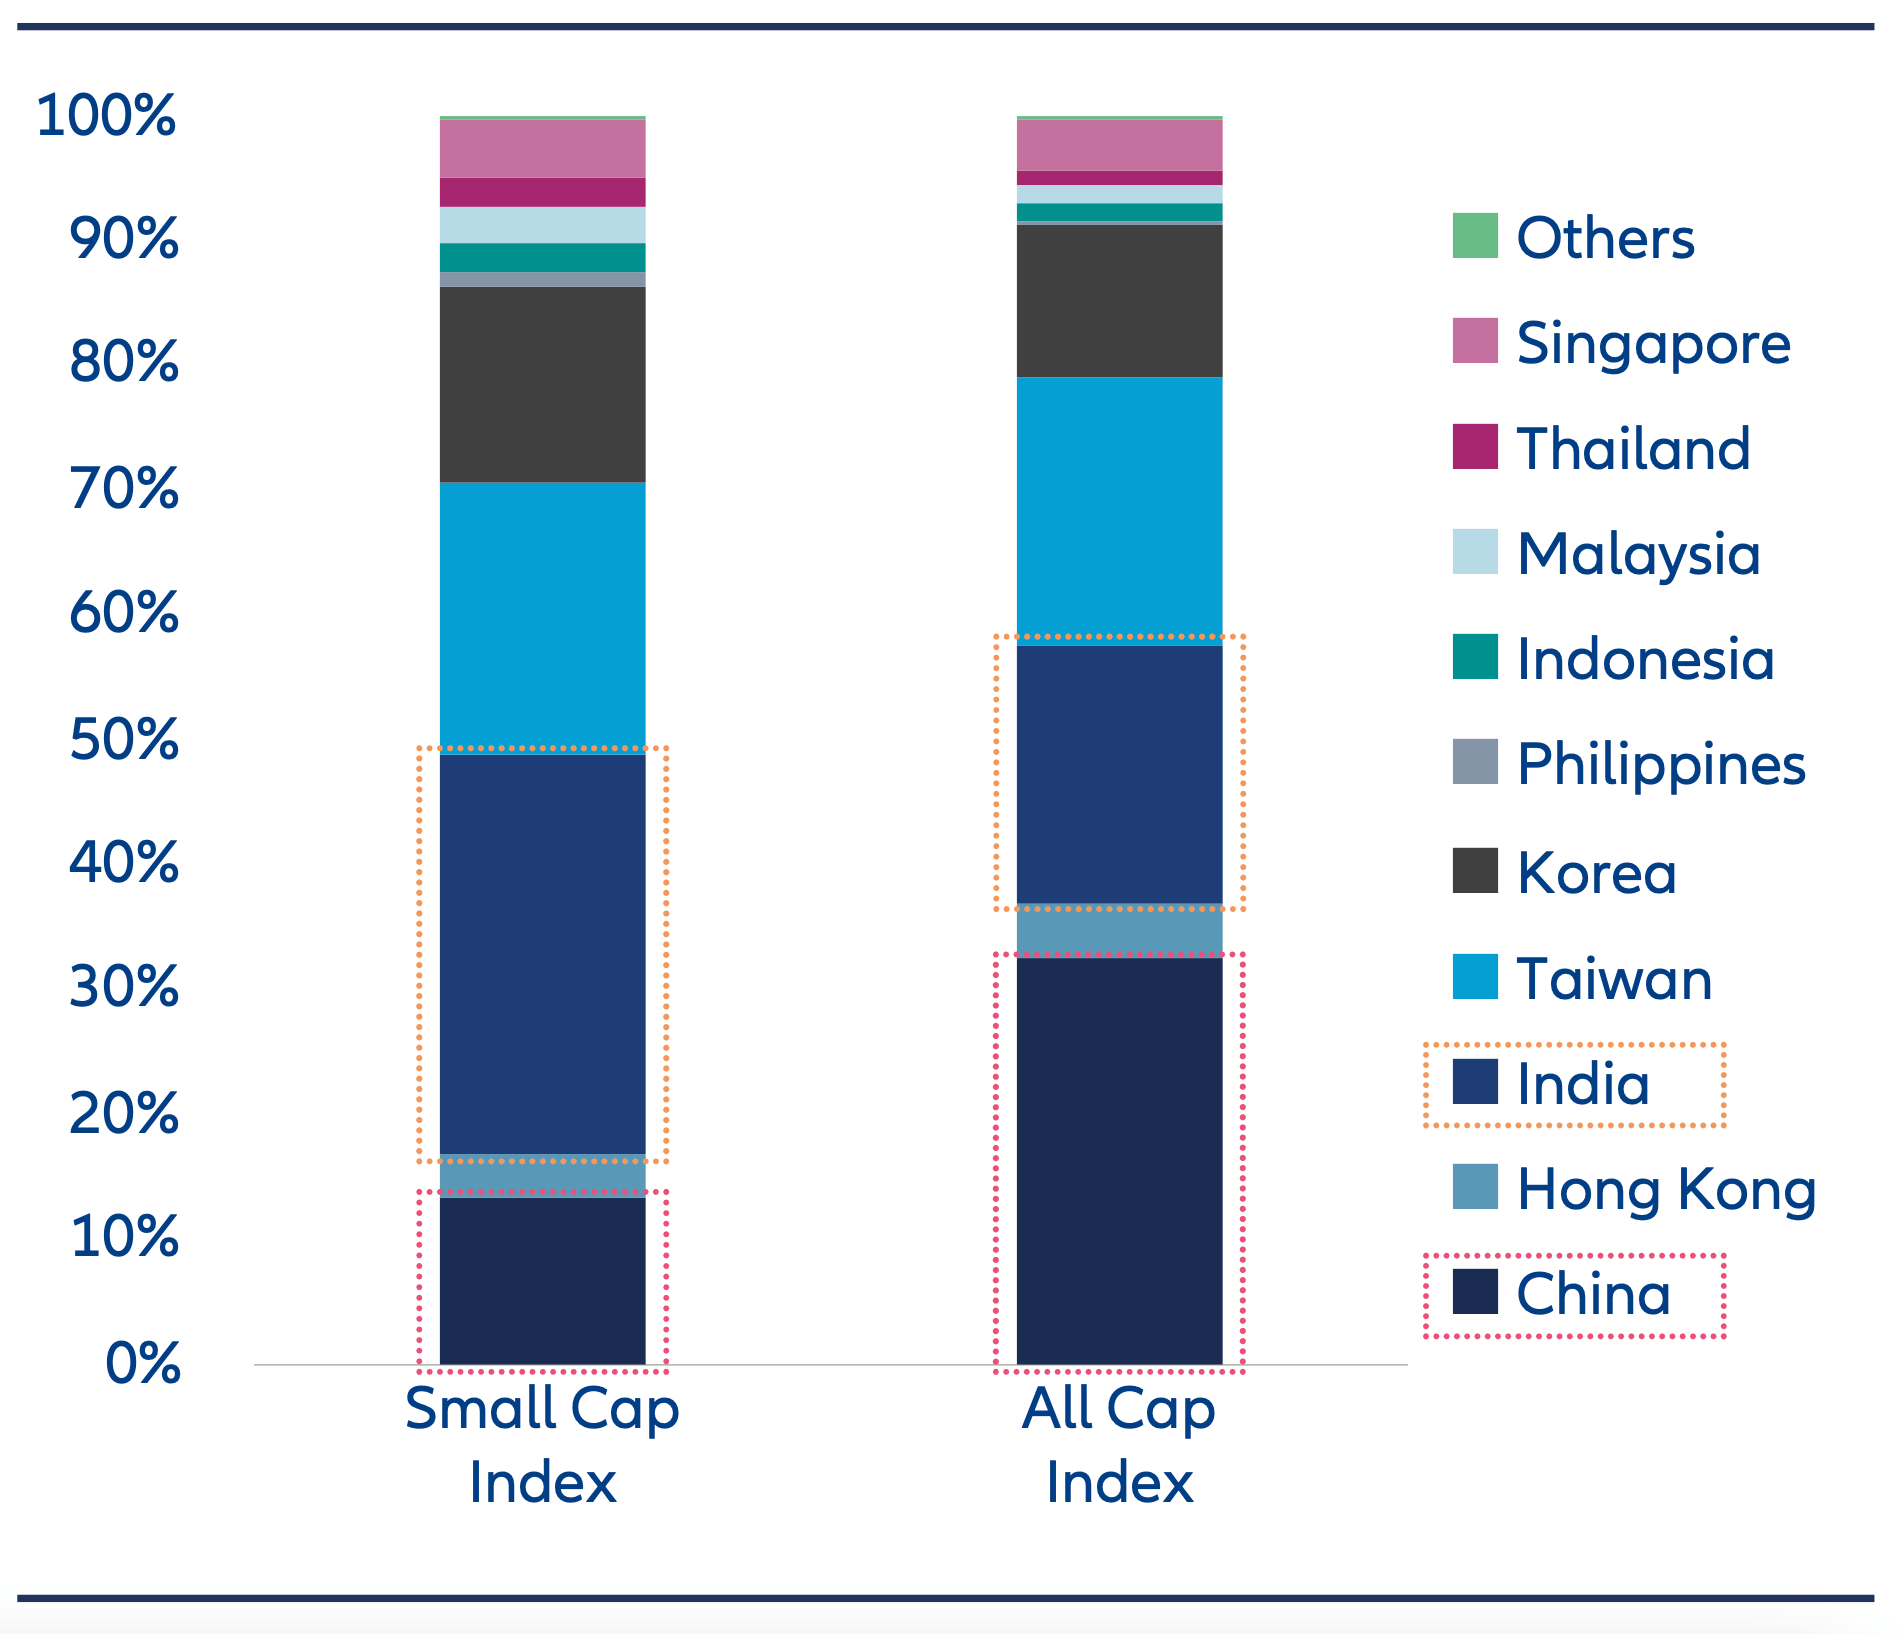
Source: IDS, MSCI, Allianz Global Investors, as of 30 June 2025.
Exhibit 6: Sector breakdown – MSCI Asia ex Japan Small Cap Index
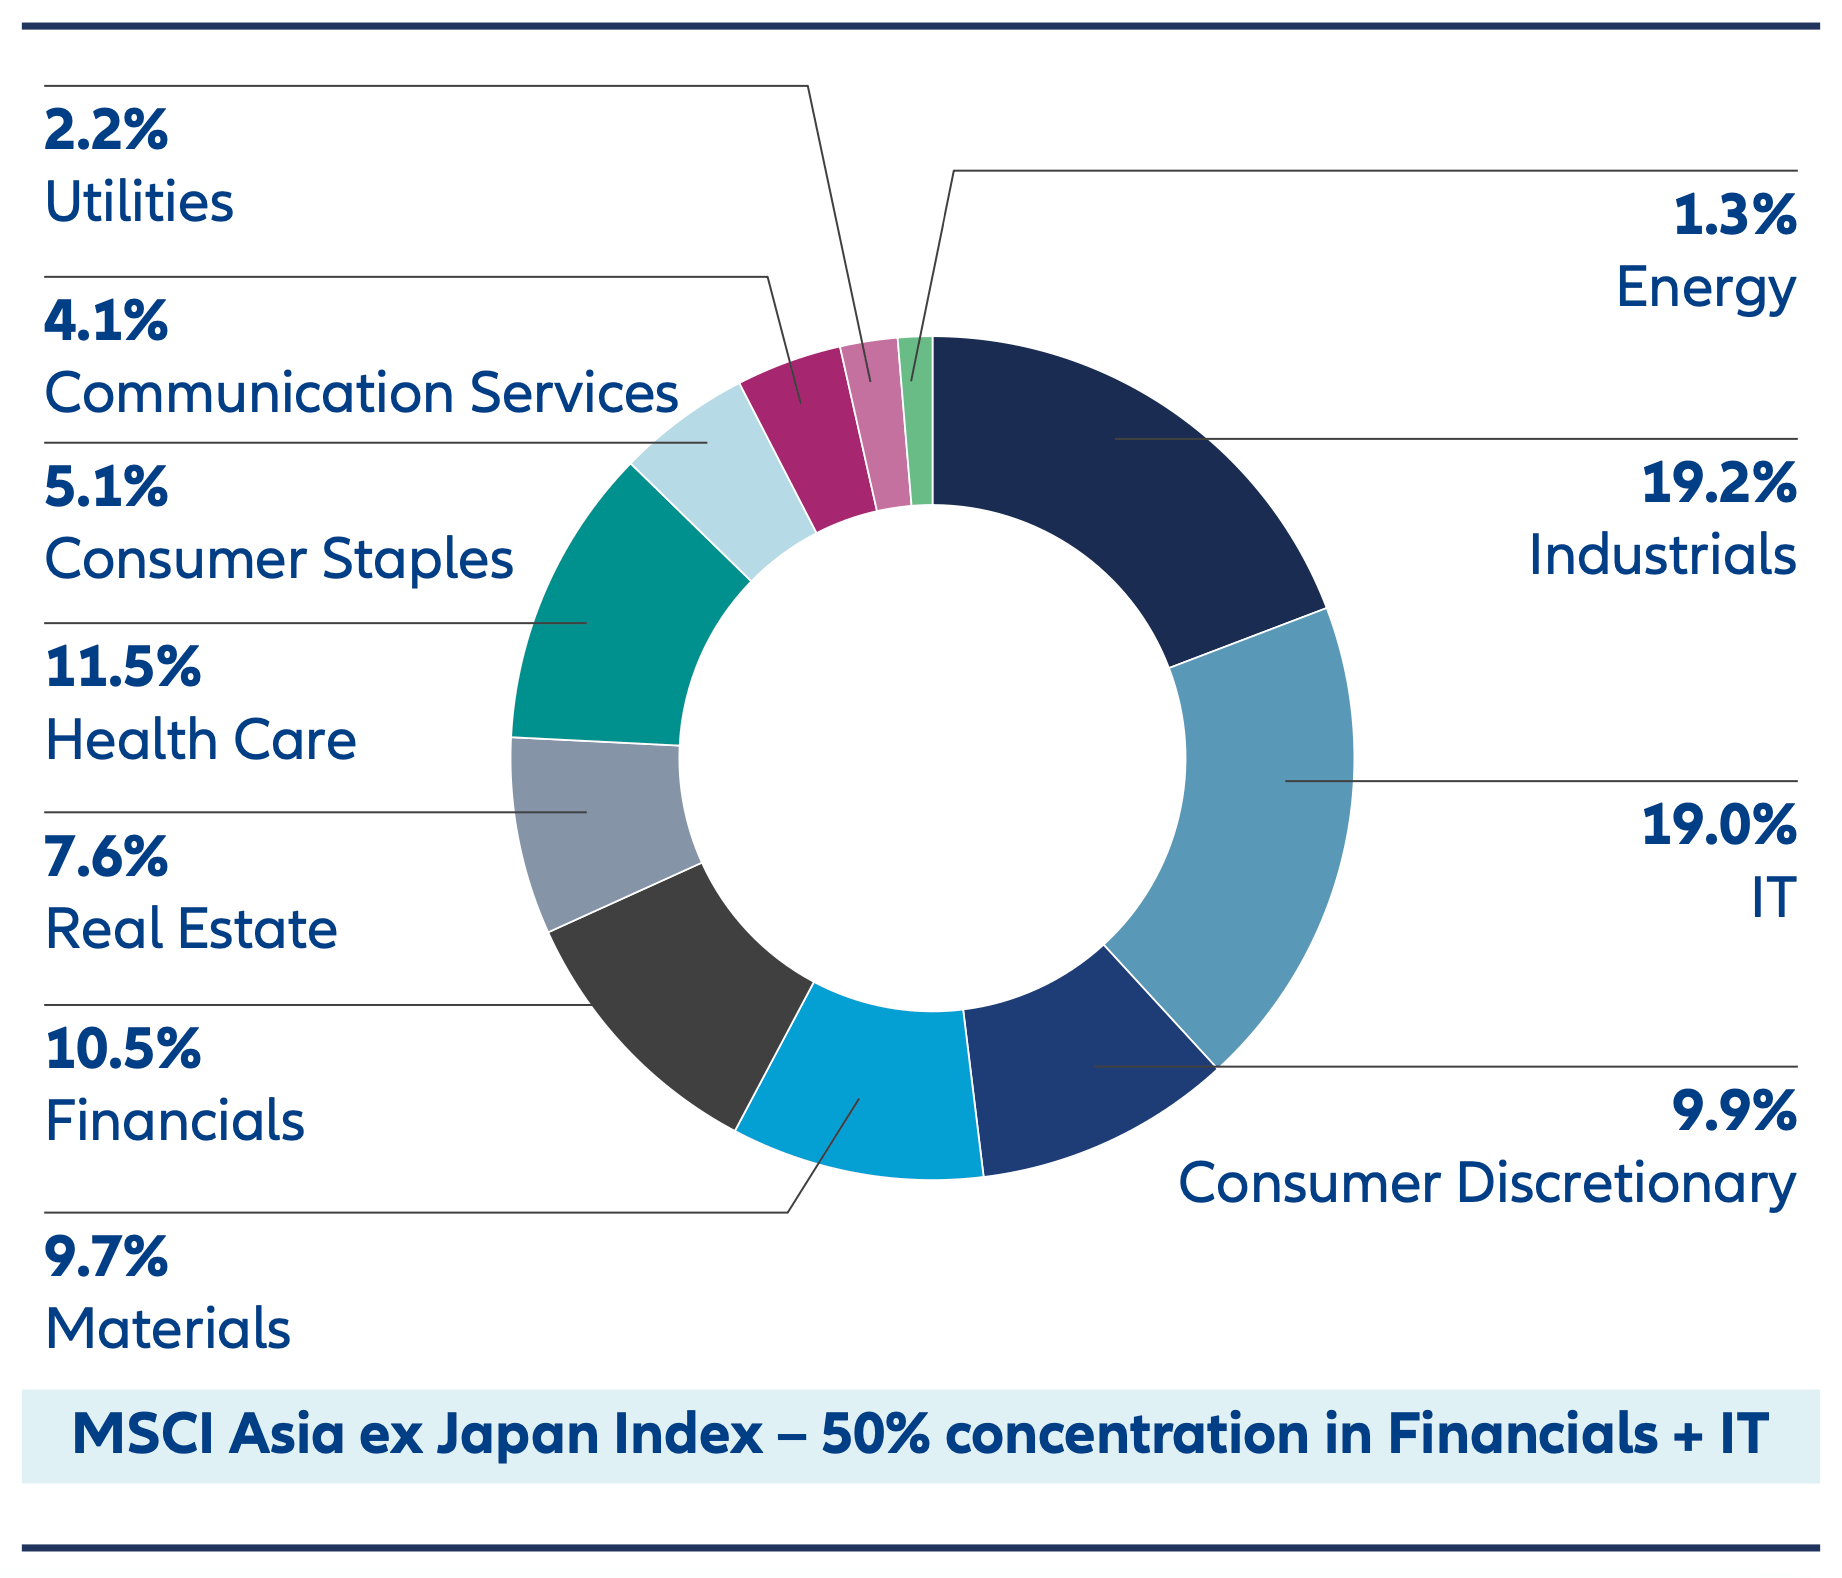
Source: IDS, MSCI, Allianz Global Investors, as of 30 June 2025.
Alpha potential of small caps – As we consider the region’s growth potential, several powerful themes are emerging. In artificial intelligence, much of the global supply chain is anchored in Taiwan, Korea, and China. Meanwhile, supply chain diversification is creating new opportunities in India and ASEAN countries. The region is also home to the world’s largest youth population, fueling emerging consumer trends in markets like India and Southeast Asia. Additionally, healthcare innovation is accelerating, with countries across Asia catching up in medical infrastructure and driving forward drug development and biotech advancements.
Many of these emerging opportunities are found among small-cap companies, as more domestic champions begin to surface across the region. These companies often receive limited attention from the sell-side, with estimates suggesting that large-cap stocks have, on average, more than twice the analyst coverage compared to small caps (Exhibit 7). This lack of coverage can lead to market inefficiencies—creating fertile ground for active managers with strong stock selection capabilities to uncover overlooked opportunities and generate alpha.
Diversification via low correlation– Given the wide array of under-the-radar investment opportunities across the region, adding Asian small caps to a portfolio can offer meaningful diversification benefits. This is supported by their historically low correlation with major global equity markets, helping to reduce overall portfolio risk while enhancing return potential (Exhibit 8).
Exhibit 7: Asian small caps’ lack of sell-side coverage leads to market inefficiencies
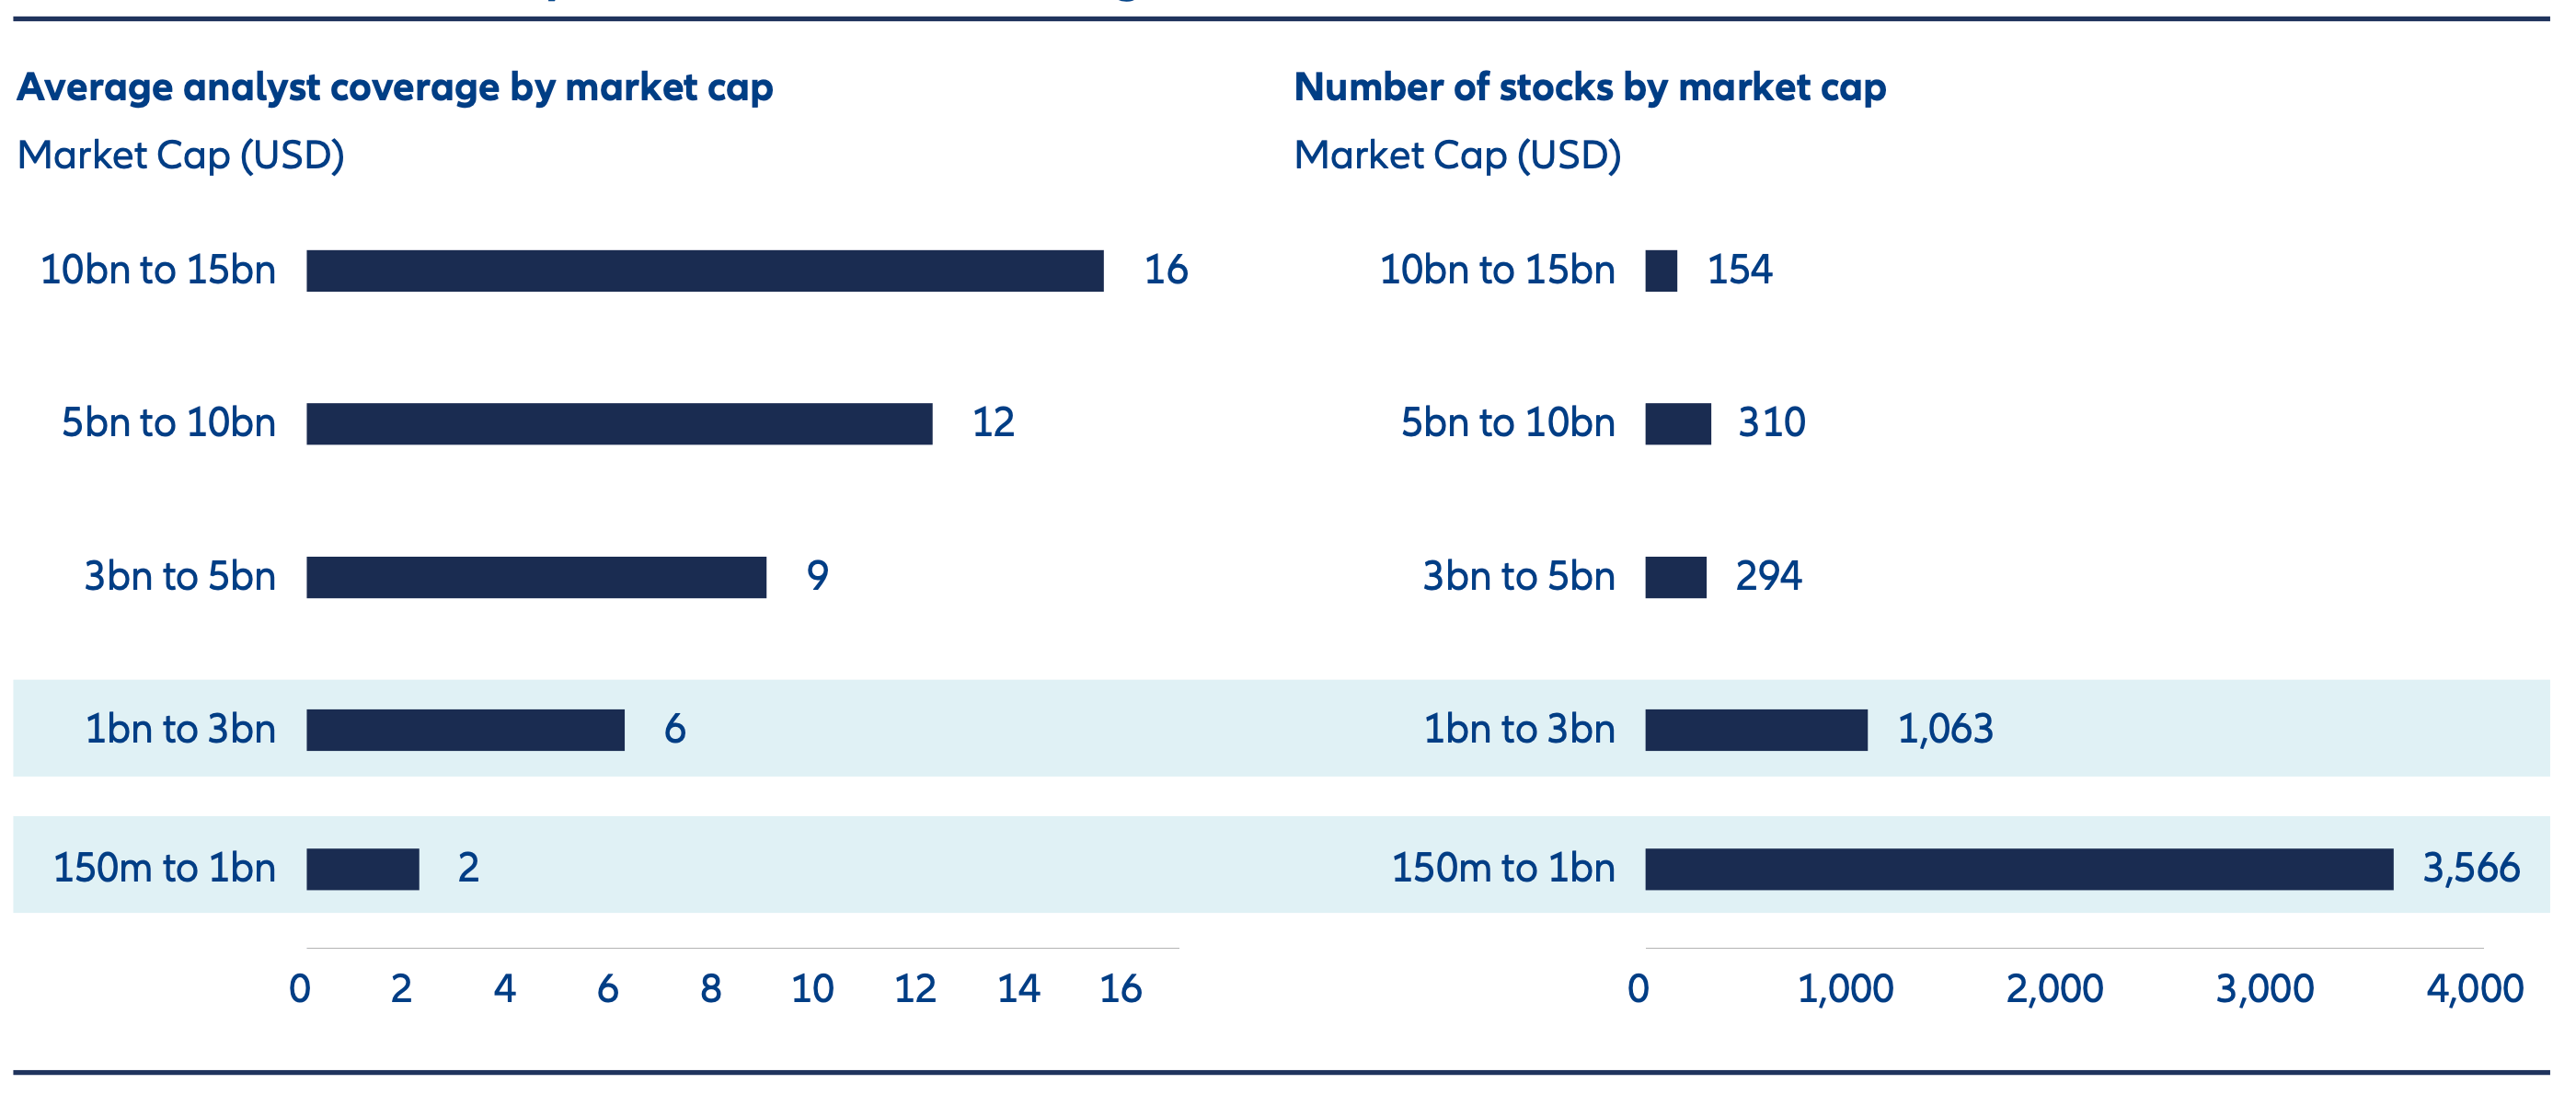
Source: FactSet, Jefferies, as of 10 July 2025. Companies above include all tradable companies with market cap above 150mn and below 15bn USD domiciled in the following markets: Hong Kong, Singapore, South Korea, Taiwan, China, India, Indonesia, Macau, Malaysia, Pakistan, Philippines, Thailand. Only common stocks (excluding foreign shares) are considered. China A-Shares stock are excluded.
Exhibit 8: Historical correlation between Allianz Asian Small Cap and other major equity markets indices (weekly USD price returns)
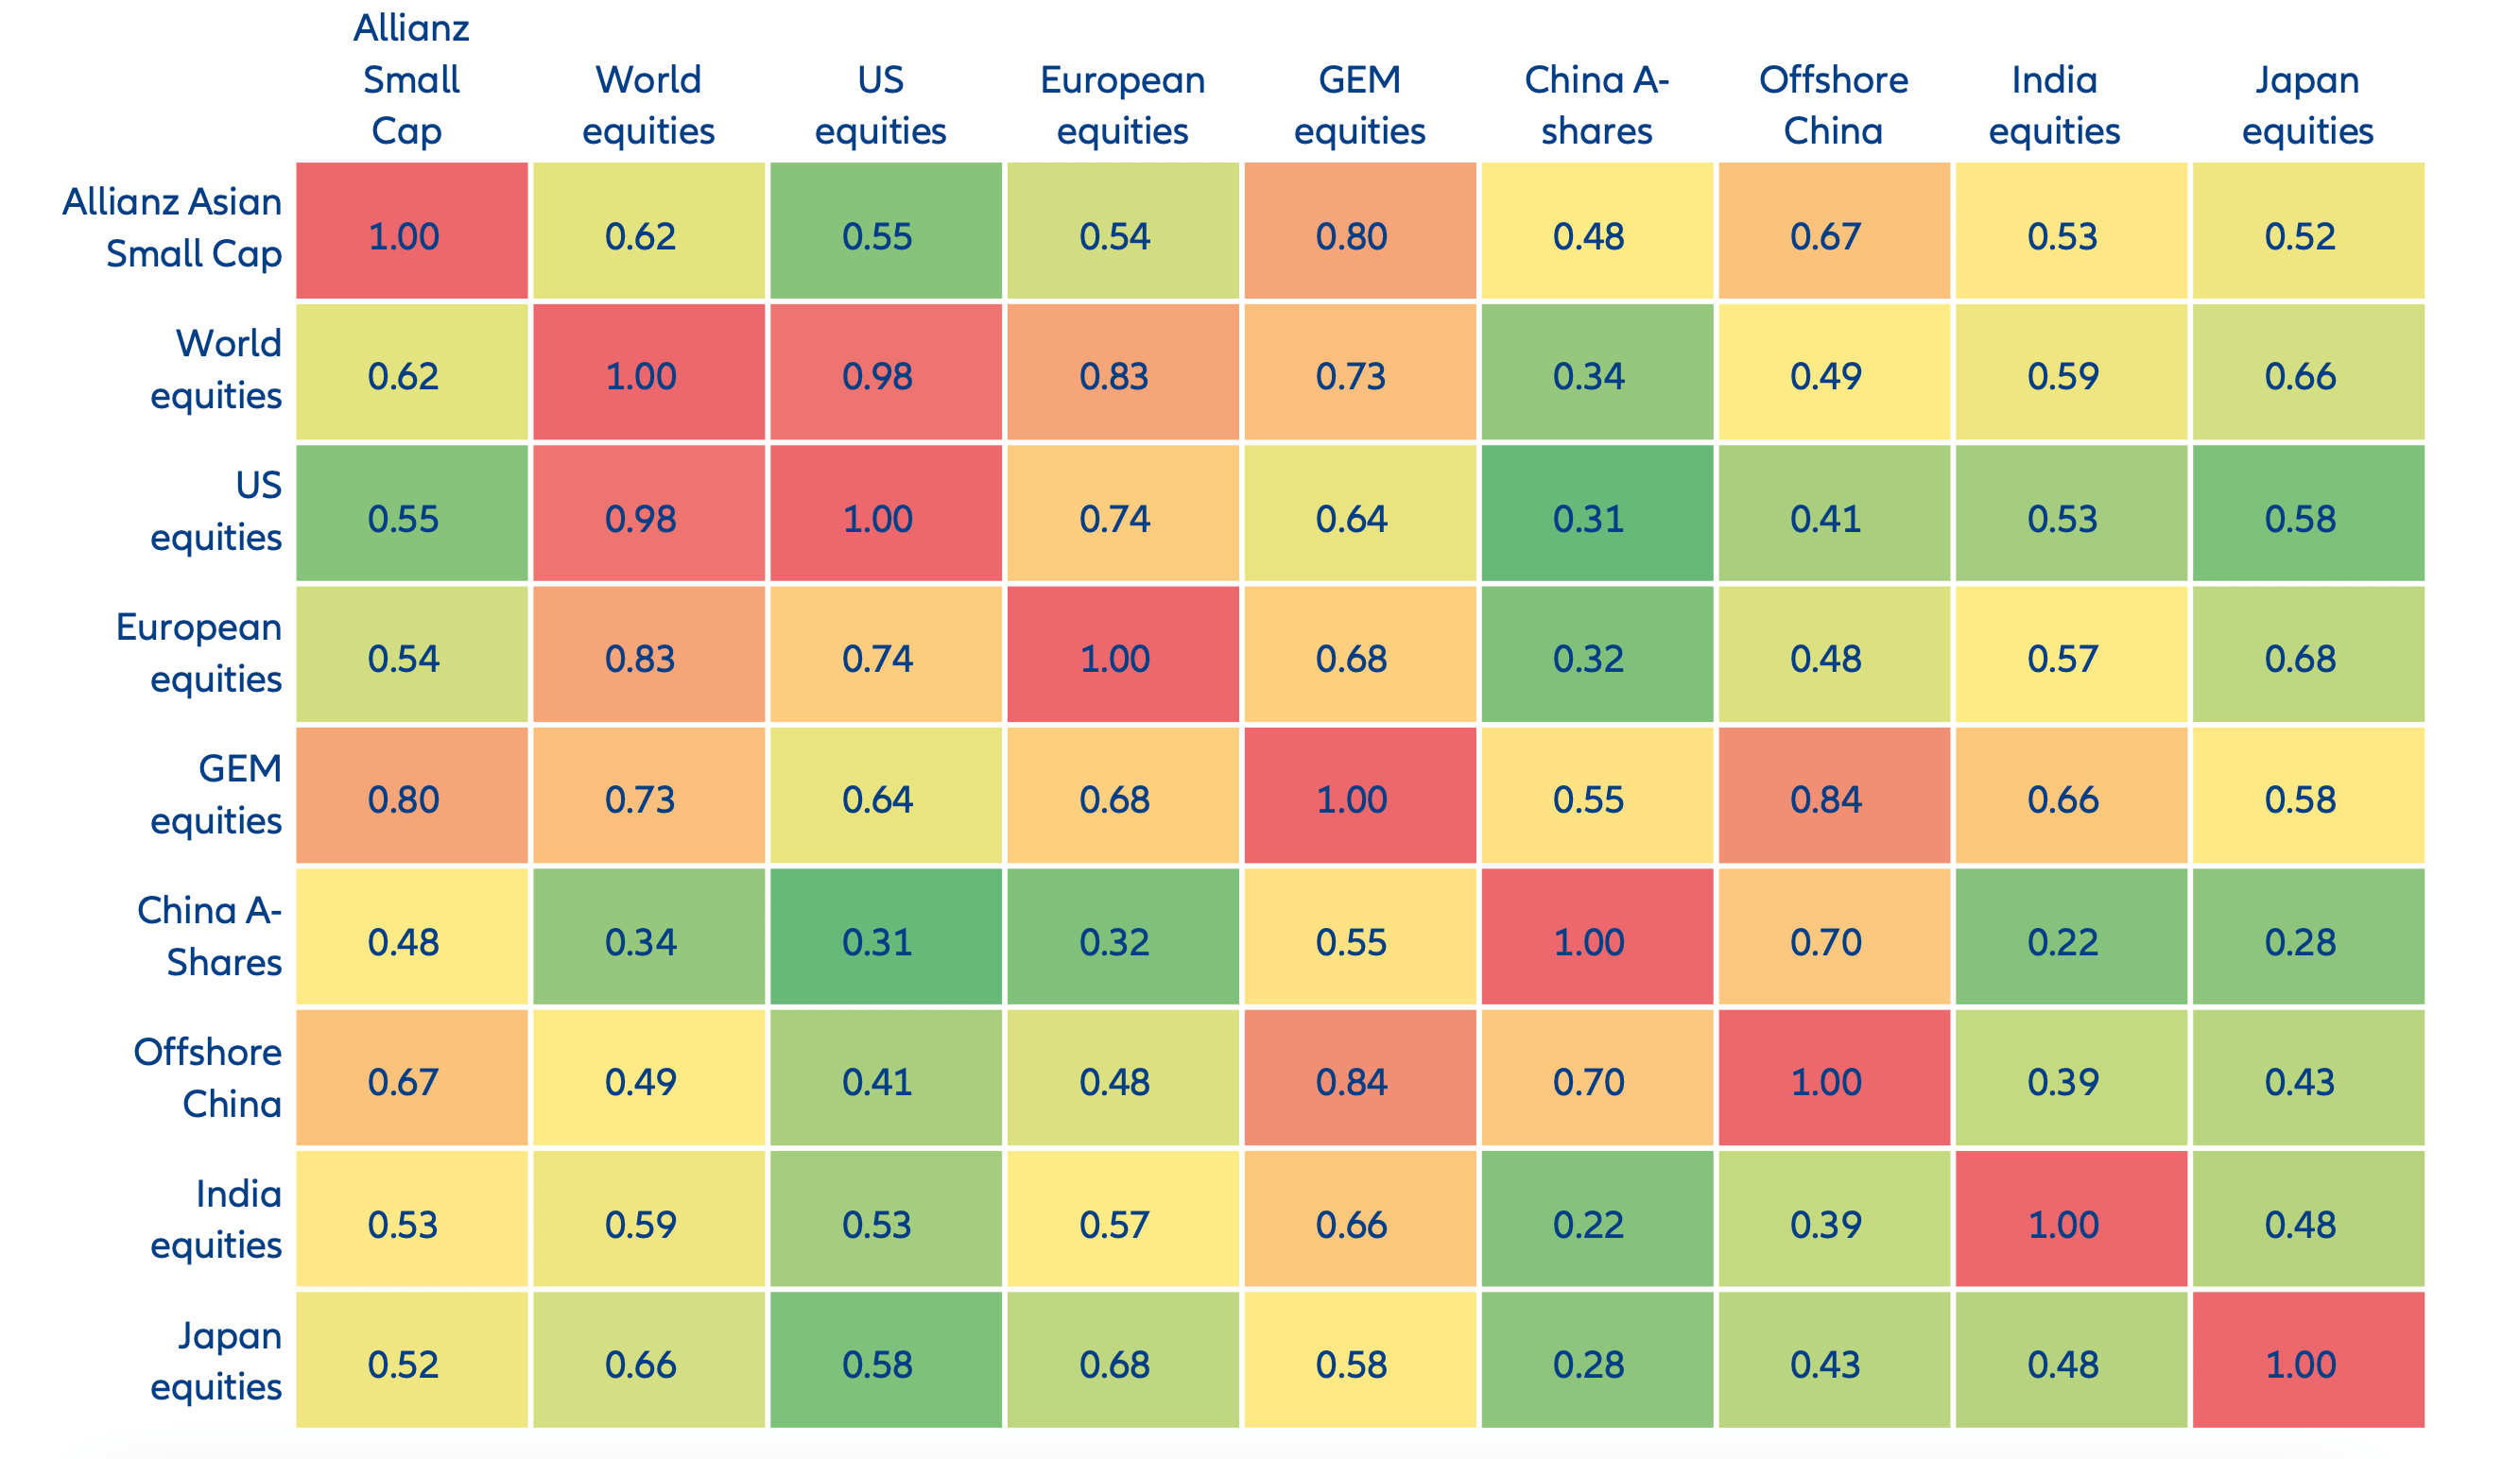
Source: Bloomberg, Allianz Global Investors, as of 30 June 2025. (LHS) Correlation data is calculated based on historical return of Allianz Asian Small Cap Equity AT15 USD class and respective MSCI indices for the past 10 years, using weekly USD return. (RHS) . Chart shows analysis of returns for the MSCI Emerging Market index (used as proxy for Global Emerging markets) and MSCI AC Asia ex Japan Small Cap index (used as proxy for the Asia Small Cap markets) indices from 30 June 2010 to 30 June 2025. Percentages shown on the chart represent portion of portfolio allocated to Asia Small Cap. Allocations shown of the MSCI Emerging Markets Index and the MSCI AC Asia ex Japan Small Cap Index represents hypothetical non- investable portfolios. The chart is provided for illustrative purposes only to analyze the various allocations of the two indexes, does not represent actual performance, and is not indicative of future results.
Artificial Intelligence
DeepSeek a likely catalyst for surge in Al applications in region. Dominant supply chain across Talwan and Korea companies in both hardware and software.
Supply chain diversification
"Chino+1" beneficiaries in India and ASEAN countries; and domestic Chinese companies to achieve sell-sufficiency.
Healthcare catch-up and innovation
Key policy priority for better quality healthcare, rapidly rising RED in innovative drugs.
Emerging consumer trends
Demographics - young population in ASEAN and India; Focus on local brands with proven business models.
In an analysis using the MSCI Emerging Markets Index as our proxy for a “core” emerging-market portfolio, we compiled historical data from the past 15 years to observe what the impact of adding the MSCI AC Asia ex Japan Small Cap to an MSCI Emerging Markets Index allocation would be on annualized risk and return. Our analysis demonstrates that increasing the allocation to Asian Small Caps would potentially result in a significant improvement in the overall risk return profile of the portfolio (Exhibit 9).
Exhibit 9: Efficient frontier – Risk return profile of MSCI AC Asia ex Japan Small Cap + MSCI EM
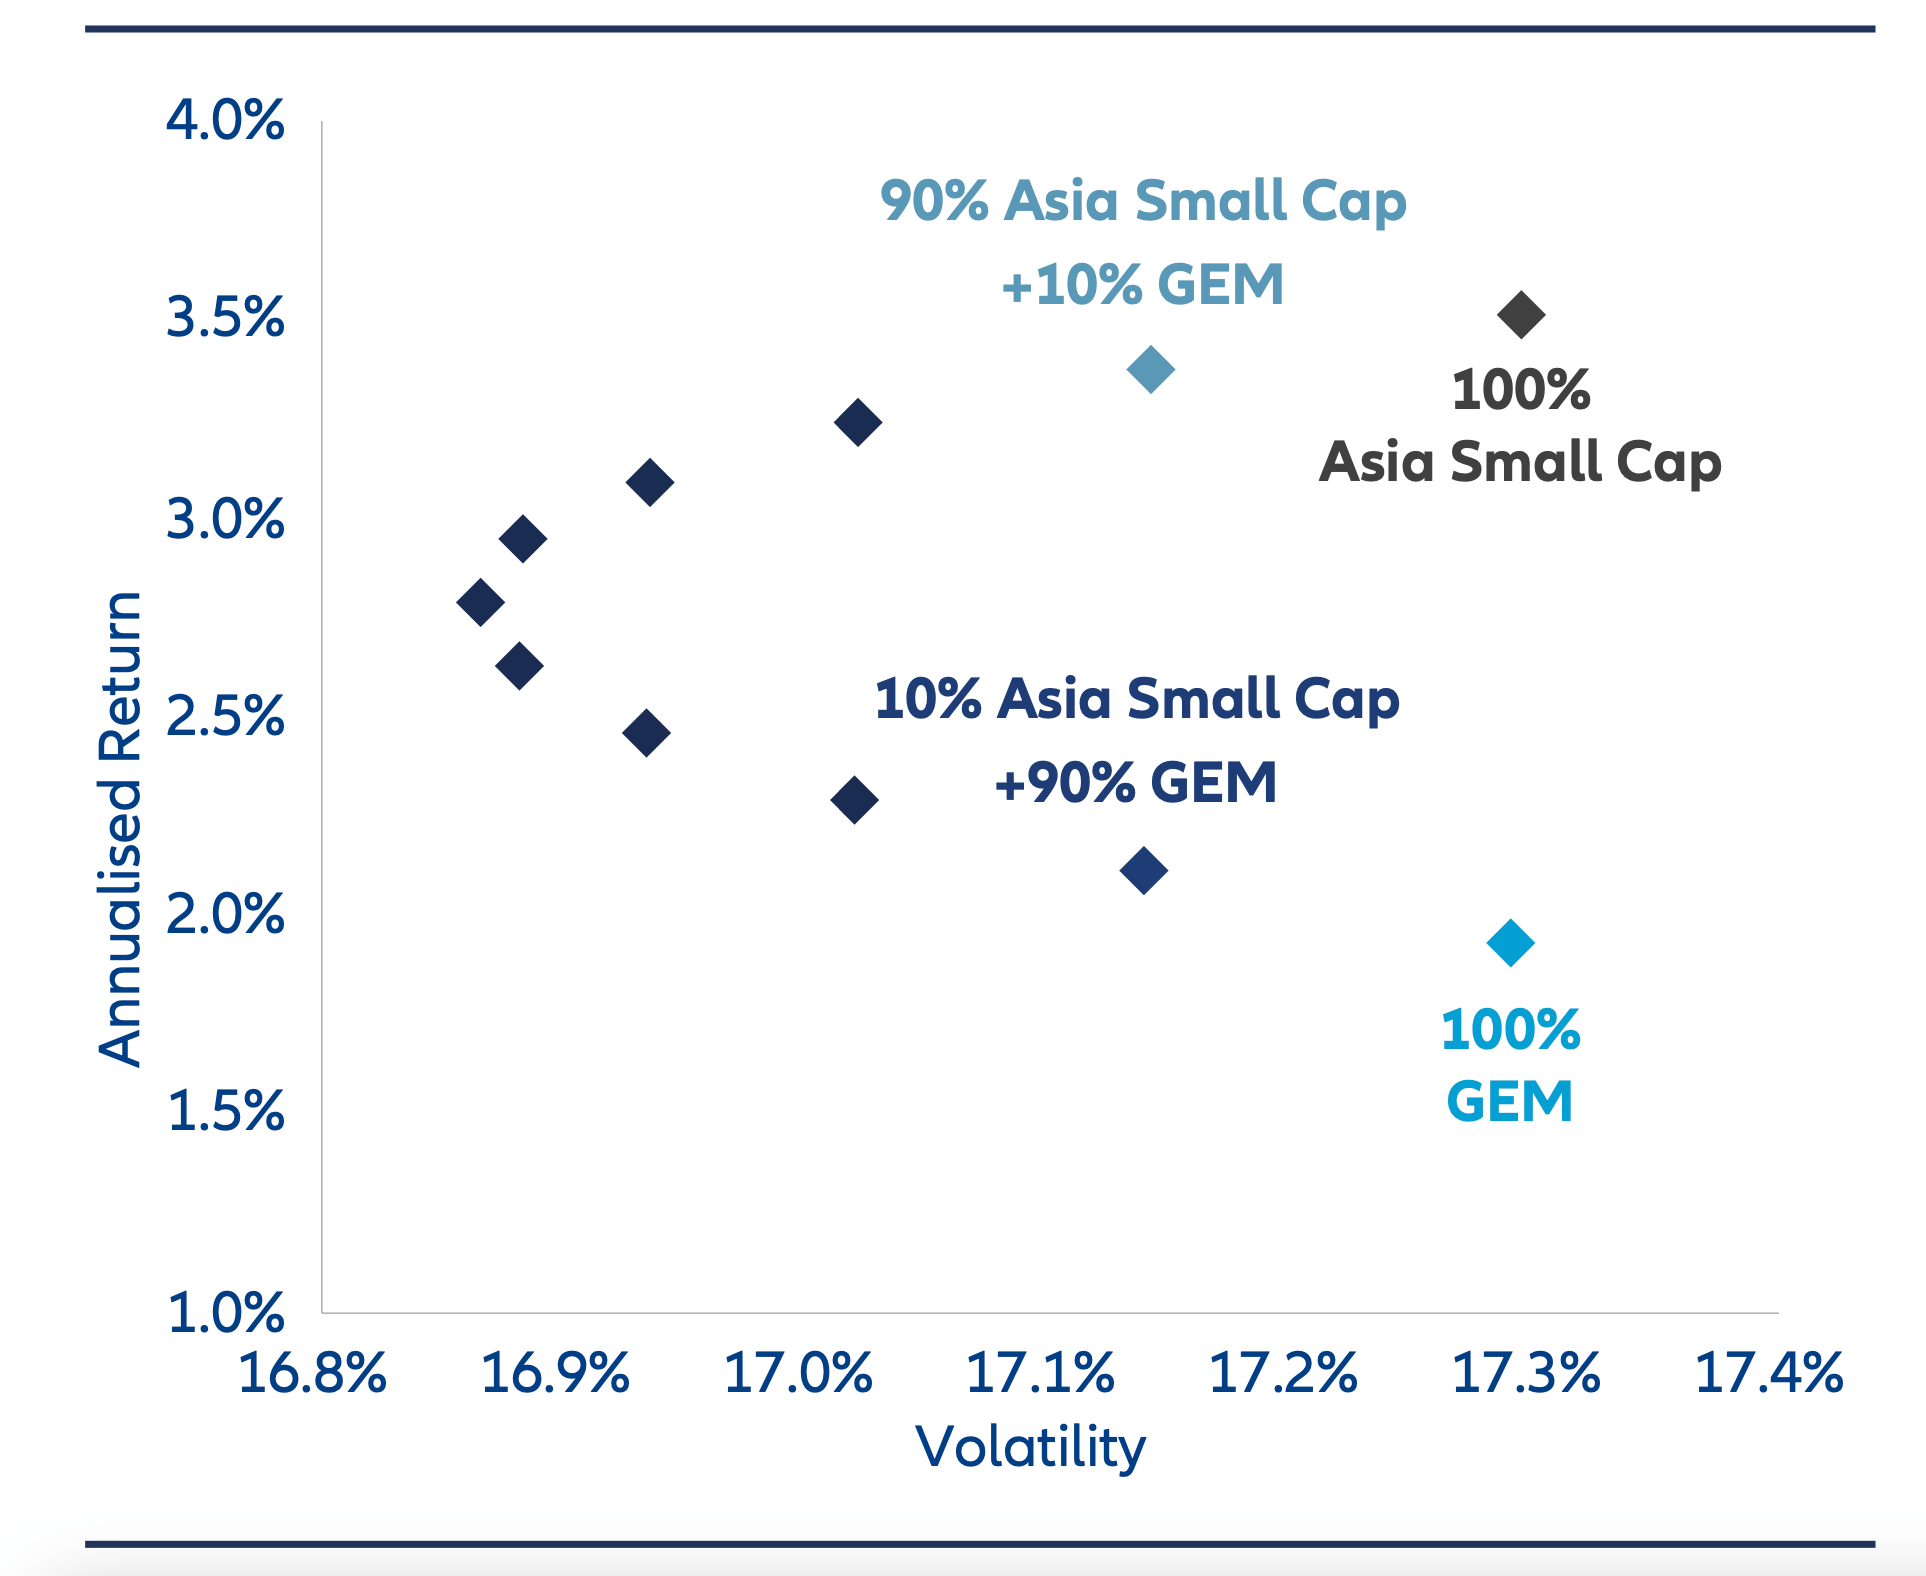
Source: Bloomberg, Allianz Global Investors, as of 30 June 2025. (LHS) Correlation data is calculated based on historical return of Allianz Asian Small Cap Equity AT15 USD class and respective MSCI indices for the past 10 years, using weekly USD return. (RHS) . Chart shows analysis of returns for the MSCI Emerging Market index (used as proxy for Global Emerging markets) and MSCI AC Asia ex Japan Small Cap index (used as proxy for the Asia Small Cap markets) indices from 30 June 2010 to 30 June 2025. Percentages shown on the chart represent portion of portfolio allocated to Asia Small Cap. Allocations shown of the MSCI Emerging Markets Index and the MSCI AC Asia ex Japan Small Cap Index represents hypothetical non-investable portfolios. The chart is provided for illustrative purposes only to analyze the various allocations of the two indexes, does not represent actual performance, and is not indicative of future results.
Conclusion
Many common investor preconceptions regarding Asian small caps are not supported by the data. However, beyond this, there are also many compelling reasons to take a closer look at this segment. As artificial intelligence transitions beyond the hype stage into more concrete applications, small to medium sized firms across Asia are well positioned to benefit, often responding more swiftly and flexibly than their larger peers.
Additionally, the ongoing shift toward “China +1” supply chain strategies is creating new growth opportunities for companies in markets such as India and Southeast Asia. Meanwhile, rising consumer demand in both India and China is reshaping industries from healthcare to digital services.
For investors seeking underappreciated growth, we view Asian Small Caps as offering a rich landscape of companies led by experienced management teams, often with balanced ownership structures, focused business goals and prudent capital allocation.


