

Navigating Rates
Bad news means better returns? The upside of uncertainty


US policy moves spanning tariffs to government spending have unsettled markets. However, analysis by our multi asset team of past periods of uncertainty suggests they may have a silver lining.
Key takeaways
- Indices measuring uncertainty about US policy are at record highs, but – counterintuitively – our analysis shows past periods of uncertainty have resulted in above-average equity returns.
- We think the findings suggest that heightened uncertainty may act as a contrarian buy signal, as markets tend to price in worst-case scenarios by the time negative headlines dominate.
- The key is to keep calm in the wake of negative news and consider active asset managers who make investment decisions based on their own research and convictions across a diversified range of assets.
Markets are reeling from elevated uncertainty: shifts in US policy over trade, fiscal policy and other areas are fanning anxiety across global markets. With indices measuring uncertainty about US policy at record highs, many analysts have warned of negative equity returns with the risk of falls in the value of portfolios.
But is this warning supported by historical evidence? To find out, we conducted a quantitative analysis of established uncertainty indices, aiming to assess the extent they were able to predict subsequent equity performance.
Negative news, positive performance?
Counterintuitively, our analysis reveals that elevated uncertainty levels led to above-average equity returns across all the prediction horizons and equity indices we analysed (see Exhibit 1).
The reason may be the speed at which bad news is reflected in equity markets. News coverage of US policy is a core input for many uncertainty indices and by the time negative news dominates the headlines, equity markets have already priced in the potential downside.
Method: explaining our Predictive Indicator Analysis
Policy uncertainty is not just perceived. It can be accurately quantified through widely cited and rigorously constructed indices that measure factors, including fiscal policy, monetary policy and trade policy.
To understand the link between uncertainty and equity returns, we conducted a comprehensive analysis focusing on two broad US economic policy uncertainty indices, and 12 categorical subindices developed by researchers Baker, Bloom and Davis – a total of 14 indices – using monthly data since 1985.1
Nearly all tested indices are currently in the top decile of uncertainty based on their full time series since 1985 (see Exhibit 2).
To further strengthen our analysis and assess the impact of US uncertainty on different geographical regions, we included the MSCI EAFE (World ex North America) and MSCI EM (Emerging Markets) in addition to the S&P 500 index.
The results informed what we’re calling our proprietary Predictive Indicator Analysis, which aims to answer what impact the level or any change in the indicator has on equity returns.
To capture both short- and medium-term market impact, we analysed three prediction horizons: one-month, three-month, and 12-month returns, each over a 40-year period.3
Exhibit 1: Equity returns following periods of high uncertainty were above average
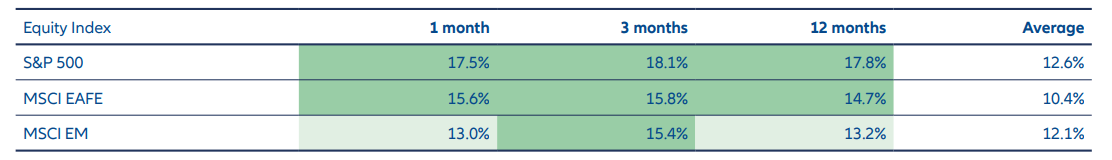
Note: Indicator – US Economic Policy US Economic Policy Uncertainty Composite Index; returns following 25% highest uncertainty levels2, returns annualised.
Source: AllianzGI calculations based on data from Baker, Bloom and Davis and Bloomberg, as of 31 March, 2025.
Exhibit 2: US uncertainty levels about everything from trade policy to taxes have surged
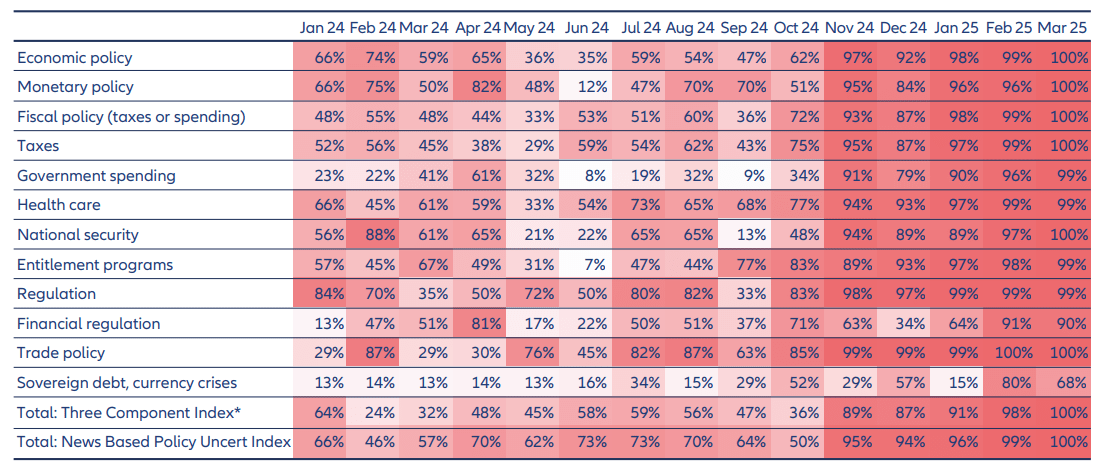
*Referred to as US Economic Policy Uncertainty Composite Index in the main text.
Source: AllianzGI calculations based on data from Baker, Bloom and Davis and Bloomberg, as of 31 March 2025.
Results: counterintuitively, high uncertainty led to strong returns
Across all prediction horizons and equity indices, returns following periods of high uncertainty – as measured by the US Economic Policy Uncertainty Composite Index4 – were considerably above average (see Exhibit 1). In other words, high uncertainty historically marked attractive entry points, with investors generously rewarded for taking elevated risk.
As an example, when the US Economic Policy Uncertainty Composite Index — the broadest of the indices we analysed — reached the highest 5% of uncertainty levels, subsequent returns of the S&P 500 over the next three months were at their strongest, hitting 5.8%. Those periods also led to only slightly higher-than-average volatility (15.2%), resulting in superior risk-adjusted performance (see Exhibit 3).
Contrary to popular belief, we found the most extreme negative returns tended to follow low or normal levels of uncertainty (dots ranging between 70 and 110 in the x-axis in Exhibit 4).
Finally, we also analysed the impact that changes in the uncertainty index had on returns. We found that three-month returns following a period when uncertainty was in the top 25% of occurrences were consistently above average (see the first row in Exhibit 5), regardless of whether uncertainty decreased, remained stable, or increased in the run-up to the three-month period. In contrast, when the uncertainty index was in the bottom 25% and decreased sharply over the prior period, the subsequent returns were negative – even though low and falling uncertainty would intuitively suggest a favourable market outcome (see bottom left bubble in Exhibit 5).
Exhibit 3: Higher uncertainty led to higher subsequent S&P 500 returns
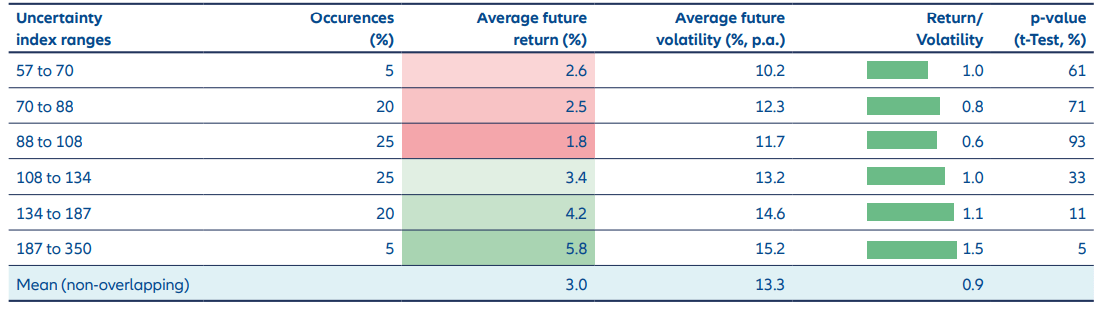
Note: Indicator – US Economic Policy Uncertainty Composite Index; equity index: S&P 500; prediction horizon: three months. The p-value is a statistical measure that indicates how likely it is that a result occurred by chance. A p-value of below 5% suggests a significantly higher return compared to the average.
Source: AllianzGI calculations based on data from Baker, Bloom and Davis and Bloomberg, as of 31 March 2025.
Exhibit 4: The majority of severe negative returns followed periods of low or normal levels of uncertainty
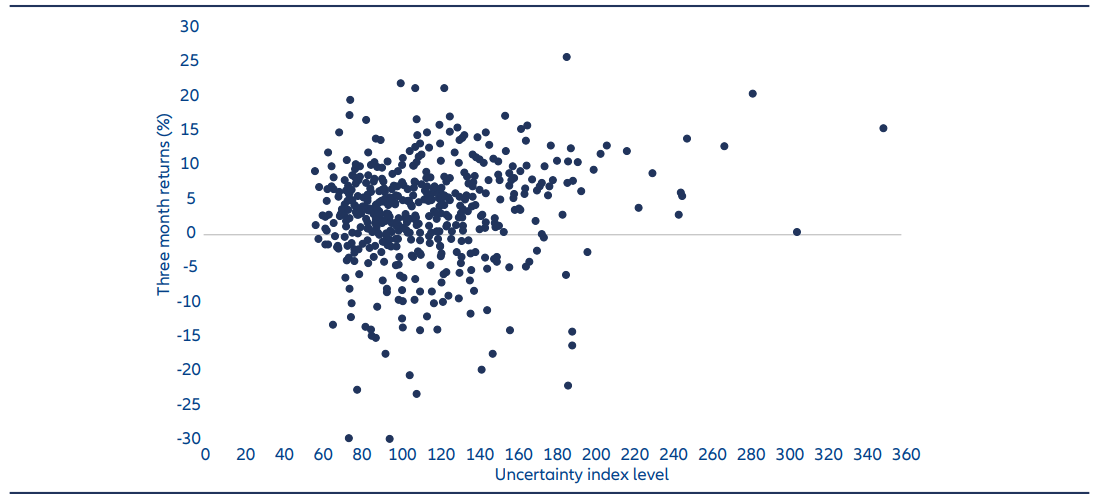
Note: Indicator – US Economic Policy Uncertainty Composite Index; equity index: S&P 500; prediction horizon: three months.
Source: AllianzGI calculations based on data from Baker, Bloom and Davis and Bloomberg. Data as of 31 March 2025.
Conclusion: heightened uncertainty may offer a rewarding entry point
Our analysis showed periods of elevated uncertainty consistently led to above-average, risk-adjusted returns across multiple equity indices, time horizons, and uncertainty indices as indicators. Since these uncertainty indices are primarily driven by news coverage, the robust findings suggest that heightened uncertainty may act as a contrarian buy signal, as markets tend to price in the worstcase scenarios by the time negative headlines dominate. Panic sells papers but it may also create opportunities.
Research from Baker, Bloom, and Davis (2016) demonstrates that elevated policy uncertainty tends to dampen investment and employment. Our indicator analysis offers a different perspective. Focusing on short- to medium-term equity performance, we find that, despite the clear adverse impact on the real economy, equity markets have historically delivered above-average returns in the immediate aftermath of negative policy news.
Exhibit 5: Three-month returns after a period of high uncertainty were consistently above average, regardless of the previous changes in uncertainty levels
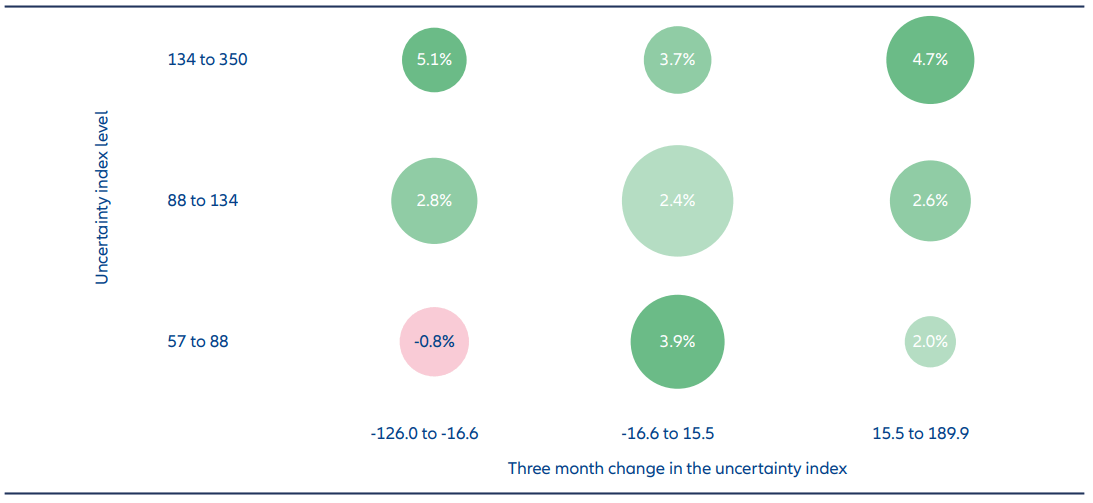
Note: The size of the bubble represents the percentage of occurrences. Indicator: US Economic Policy Uncertainty Composite Index and its changes; equity index: S&P 500; prediction horizon: three months.
Source: AllianzGI calculations based on data from Baker, Bloom and Davis and Bloomberg, as of 31 March 2025.
Diversification can help portfolios manage uncertainty – while allowing for buying opportunities
The takeaway for investors? Many market participants may feel like recent months have delivered a steady stream of unexpected twists in US policy. But it is important to stay focused on long-term goals: periods of uncertainty generally don’t last and can be managed. Investing in a diversified range of assets, overseen by an active manager making decisions based upon proprietary research, can help boost performance across all policy backdrops – when markets have clarity about US government plans and when they don’t. Market uncertainty can be unsettling, but it can offer a risk premium: greater risk may bring rewards.
1 Measuring Economic Policy Uncertainty, by Scott Baker, Nicholas Bloom and Steven J. Davis, http://www.policyuncertainty.com
2 The allocation of historical uncertainty levels to percentile ranges is based on full hindsight, using the complete time series of available uncertainty data. As such, the Predictive Indicator Analysis should not be regarded as an out-of-sample backtest (a backtest assesses the viability of a model by discovering how it would play out using historical data). Before analysing the time series for their predictive power as a potential indicator, we evaluated their suitability and key statistical properties.
3 Using this approach, we conducted 126 separate analyses (three equity indices, three prediction horizons, and 14 policy uncertainty indicators). Each analysis tested the predictive power of the indicator’s level, its past change, and the combination of both factors. Although we do not present the results of all 126 analyses in this article, the illustrative examples we cite are representative of the full set of results.
4 Referred to as Total: Three Component Index in Exhibit 2.


