

Navigating Rates
Interesting rates: What can bonds tell multi asset investors about the future?


Bond markets don’t just guide fixed income decision-making. They can help with investors’ broader allocation decisions by offering insight into a range of different asset classes. With yields down sharply in recent months, which assets could be poised to benefit?
Key takeaways
- Changes in bond yields can have a significant impact on subsequent returns across asset classes.
- Monitoring and reacting to shifts in yields can therefore be an advantage for active multi asset strategies.
- Our research suggests a strong decline in yields (of 50bp or more) is the most favourable environment for returns across several asset classes.
- US small cap equities have historically been a notable beneficiary of a strong decline in yields: since 1988, on average it is the only time they have outperformed large caps.
There is a popular saying on Wall Street: bonds are smarter than equities. This stems from the fact that bond markets can tell us something about the future – since bond yields reflect market expectations for changes in interest rates, they also reflect market expectations about coming changes in economic conditions.
Bond markets have also historically shown predictive qualities. For example, an inverted US Treasury yield curve (where yields on short bonds are above those on longer bonds) has historically been a strong predictor of a coming US recession and thereby often negative equity returns.
As a result, multi asset managers closely monitor bond market dynamics to help guide their asset allocation decisions. With central banks on the cusp of a monetary policy regime change, what are bonds telling us about the future today?
What does a new yield regime mean for investors?
After a prolonged rise in response to inflation-fighting interest rate hikes across 2022 and 2023, bond yields in recent months have declined sharply as investor have begun to price in rate cuts, particularly from the US Federal Reserve.
The drop in 10-year US Treasury (UST) yields, for example, has been remarkable not just in the context of the recent past, but historically. The -102bp change in yields (from just under 5% to under 4%) between 31 October 2023 and 31 January 2024 was in the largest 2% of rolling three-month yield declines observed since the year 1790.1
To understand what dramatic shifts in yield regimes can mean for investors, we looked at average three-month excess returns across asset classes in response to different three-month changes in 10-year UST yields.
Exhibit 1 shows historical average excess returns across four distinct yield regimes:
- Strong yield decline (three-month decline larger than –50bp)
- Slight yield decline (three-month decline between –50bp and 0bp)
- Slight yield increase (three-month increase between 0bp and +50bp)
- Strong yield increase (three-month increase larger than +50bp)
Exhibit 1: Asset classes respond differently to yield regimes
Average three-month excess return of asset classes following different 10-year UST yield changes
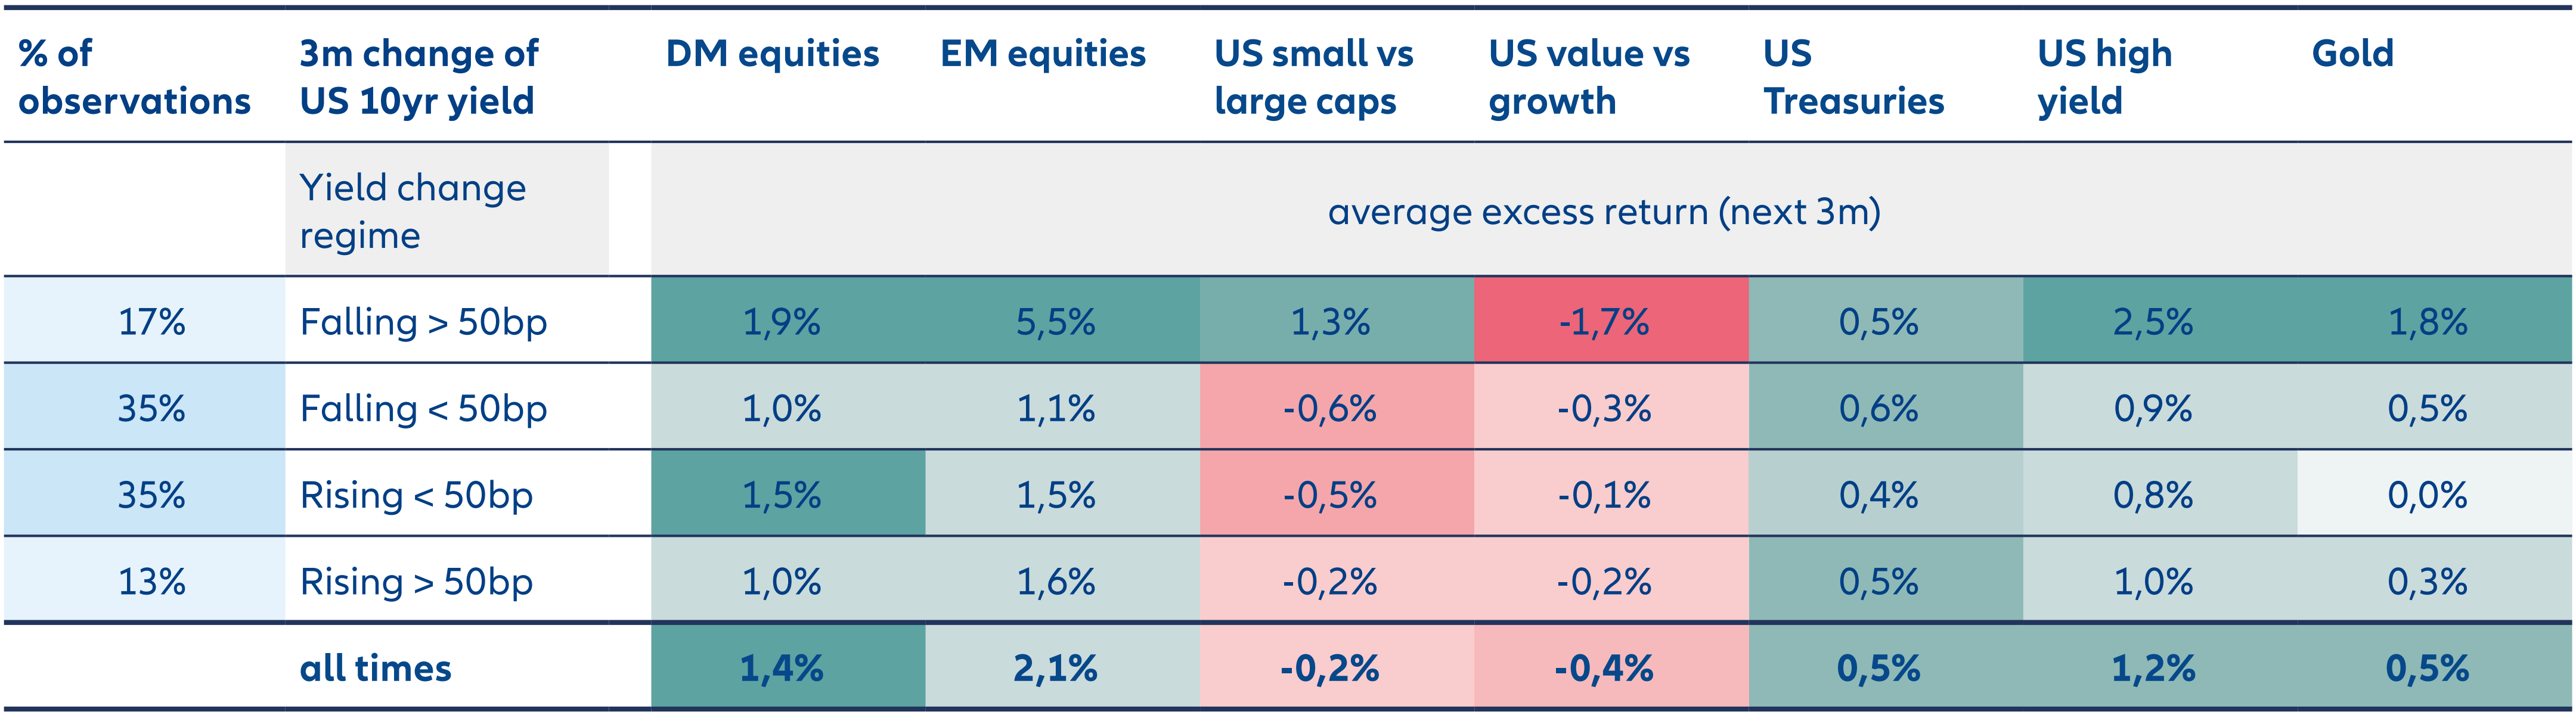
Source: Bloomberg, AllianzGI, 31 January 2024. Yield regimes based on rolling three-month time periods January 1988 to January 2024. Past performance, or any prediction, projection or forecast, is not indicative of future performance. DM Equity is represented by MSCI World, EM Equity by MSCI Emerging Markets, US Small vs Large Cap by Russell 2000 vs S&P 500, US Value vs Growth by Russell 1000 Value vs Russell 1000 Growth, US Treasuries by Bloomberg US Treasury Total Return, US High Yield by Bloomberg US Corporate High Yield and Gold by Gold US Dollar Spot.
As Exhibit 1 shows, in general, a strong decline in yields is more favourable to average excess returns across several asset classes than any other environment.
Returns for developed market equities after a strong decline in yields are roughly double what they are after a strong increase in yields, for example (1.9% versus 1.0%). Emerging market equities have also performed far better following a strong decline in yields than under any other regime, and the same goes for US high yield bonds.
If we extend the horizon to six and 12 months following a strong yield decline, we see strengthening average excess returns across those asset classes (see Exhibit 2).
Exhibit 2: Excess returns strengthen following a strong yield decline
Average three-month excess return of asset classes following different 10-year UST yield changes
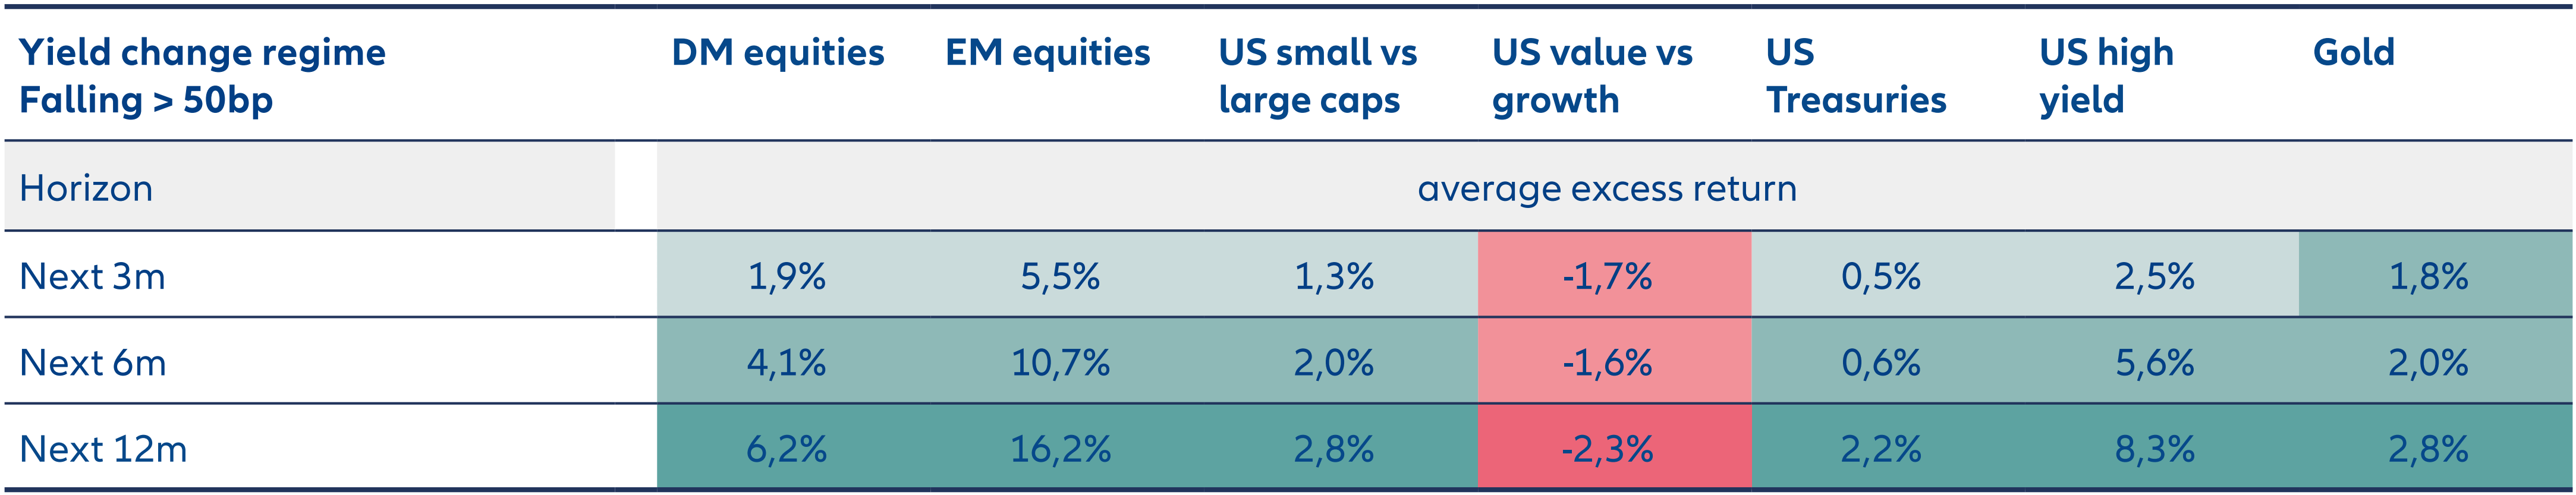
Source: Bloomberg, AllianzGI, 31 January 2024. Yield regimes based on rolling three-month time periods January 1988 to January 2024. Past performance, or any prediction, projection or forecast, is not indicative of future performance. DM Equity is represented by MSCI World, EM Equity by MSCI Emerging Markets, US Small vs Large Cap by Russell 2000 vs S&P 500, US Value vs Growth by Russell 1000 Value vs Russell 1000 Growth, US Treasuries by Bloomberg US Treasury Total Return, US High Yield by Bloomberg US Corporate High Yield and Gold by Gold US Dollar Spot.
US small cap vs. large cap equities
The above analysis also reveals a relationship between yield regimes and relative performance between sectors, with the most notable being US small cap versus US large cap equities.
As Exhibit 1 shows, small caps outperformed large caps by 1.3% on average in the three months following a strong decline in yields, but underperformed large caps under all other regimes. And as Exhibit 3 shows, that relationship holds and the performance gap grows wider over the subsequent six and 12 months.
Exhibit 3: Falling yields favour US small cap equities
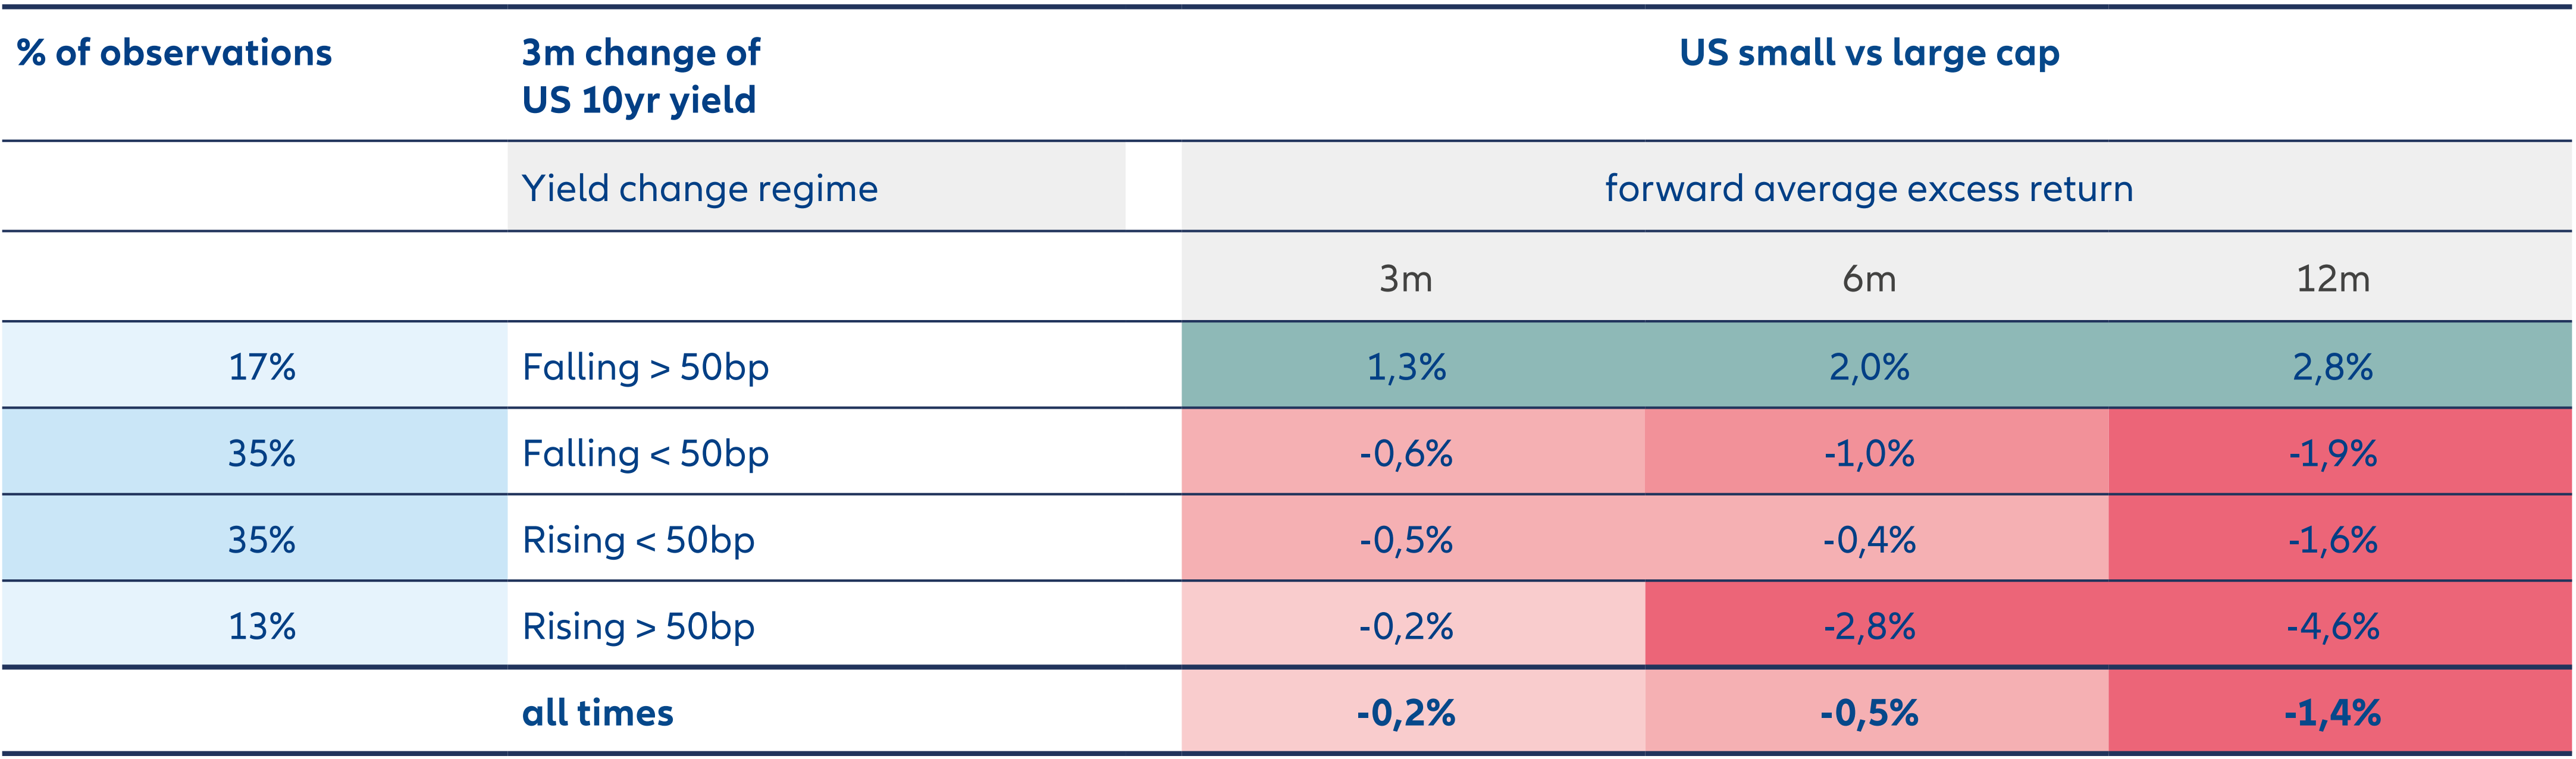
Source: Bloomberg, AllianzGI, 31 January 2024. Yield regimes based on rolling three-month time periods January 1988 to January 2024. US Small vs Large Cap represented by Russell 2000 vs S&P 500. Past performance, or any prediction, projection or forecast, is not indicative of future performance.
Although average performance figures provide a concise way to summarise a vast amount of data, it is crucial to also look at individual data points to gain a deeper understanding.
Exhibit 4 illustrates every individual data point going into the previous analysis, and two observations emerge. First, after a strong rise in yields the number of data points showing outperformance by US small caps (dots above the x-axis) decreases. Second, instances of substantial outperformance by US small caps (ie, more than 5%) are predominantly observed following periods of falling or only moderately increasing yields.
Exhibit 4: Substantial small cap outperformance predominantly occurs after drop in yields
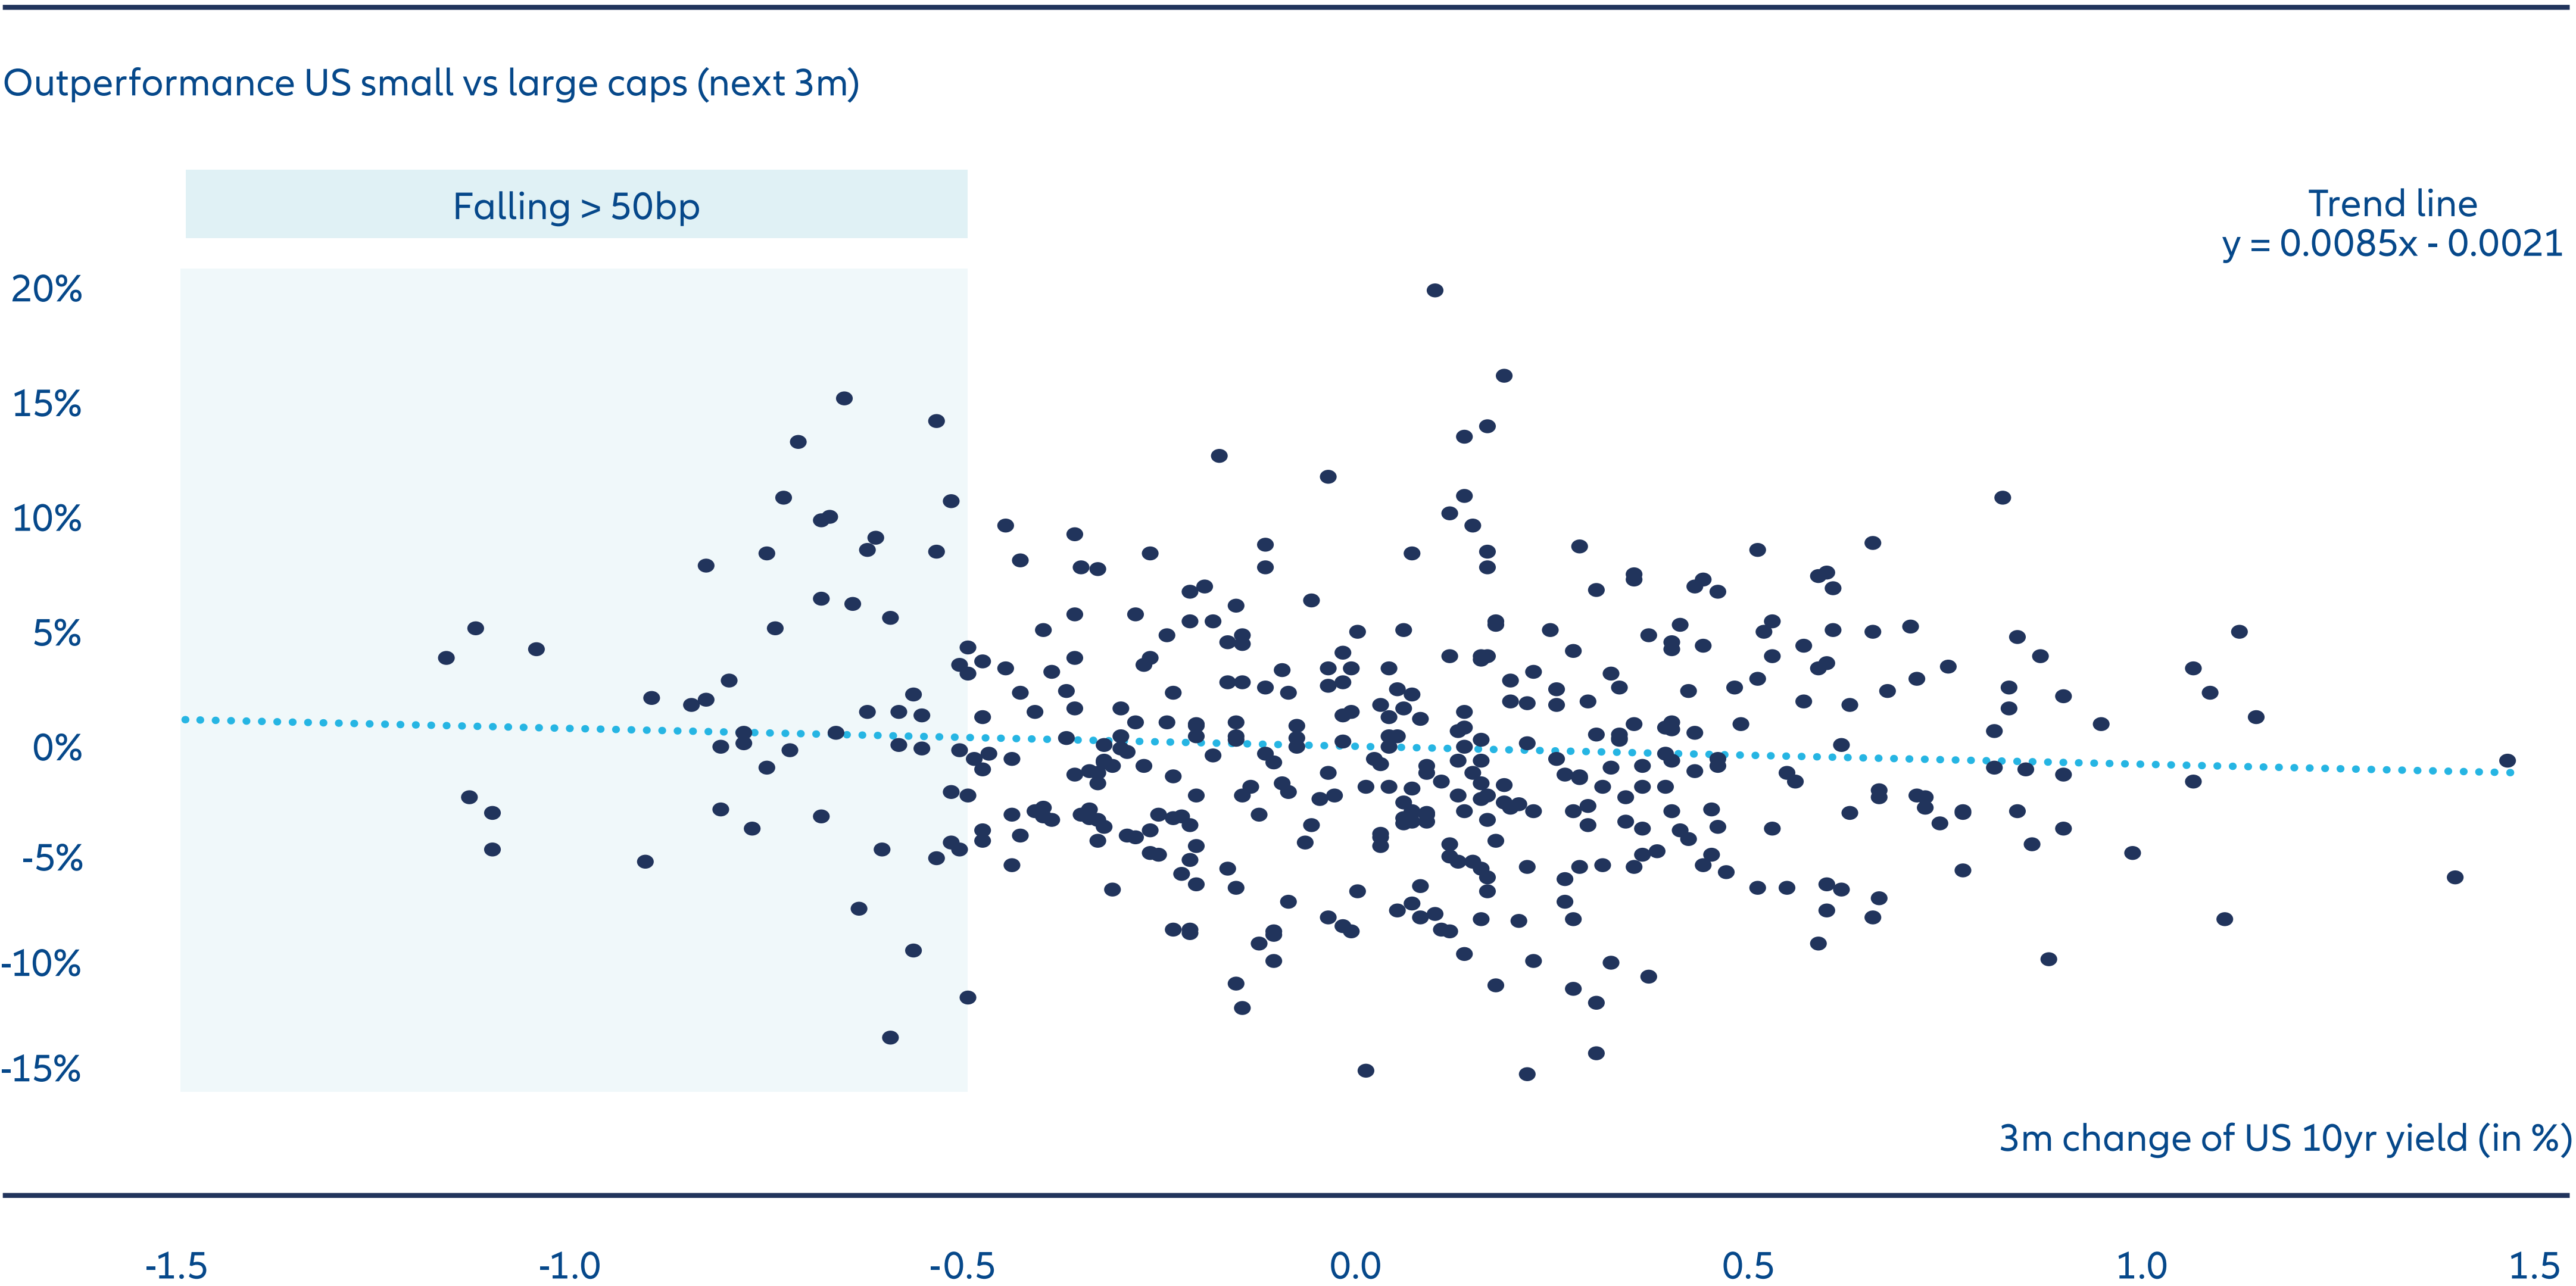
Source: Bloomberg, AllianzGI, 31 January 2024. Yield regimes based on rolling three-month time periods January 1988 to January 2024. US Small vs Large Cap represented by Russell 2000 vs S&P 500. Past performance, or any prediction, projection or forecast, is not indicative of future performance.
Absolute yield levels also matter
Clearly, changes in yield levels exert a strong influence on asset pricing and the performance of different asset classes. However, the absolute yield level at the time of the change also plays a significant role.
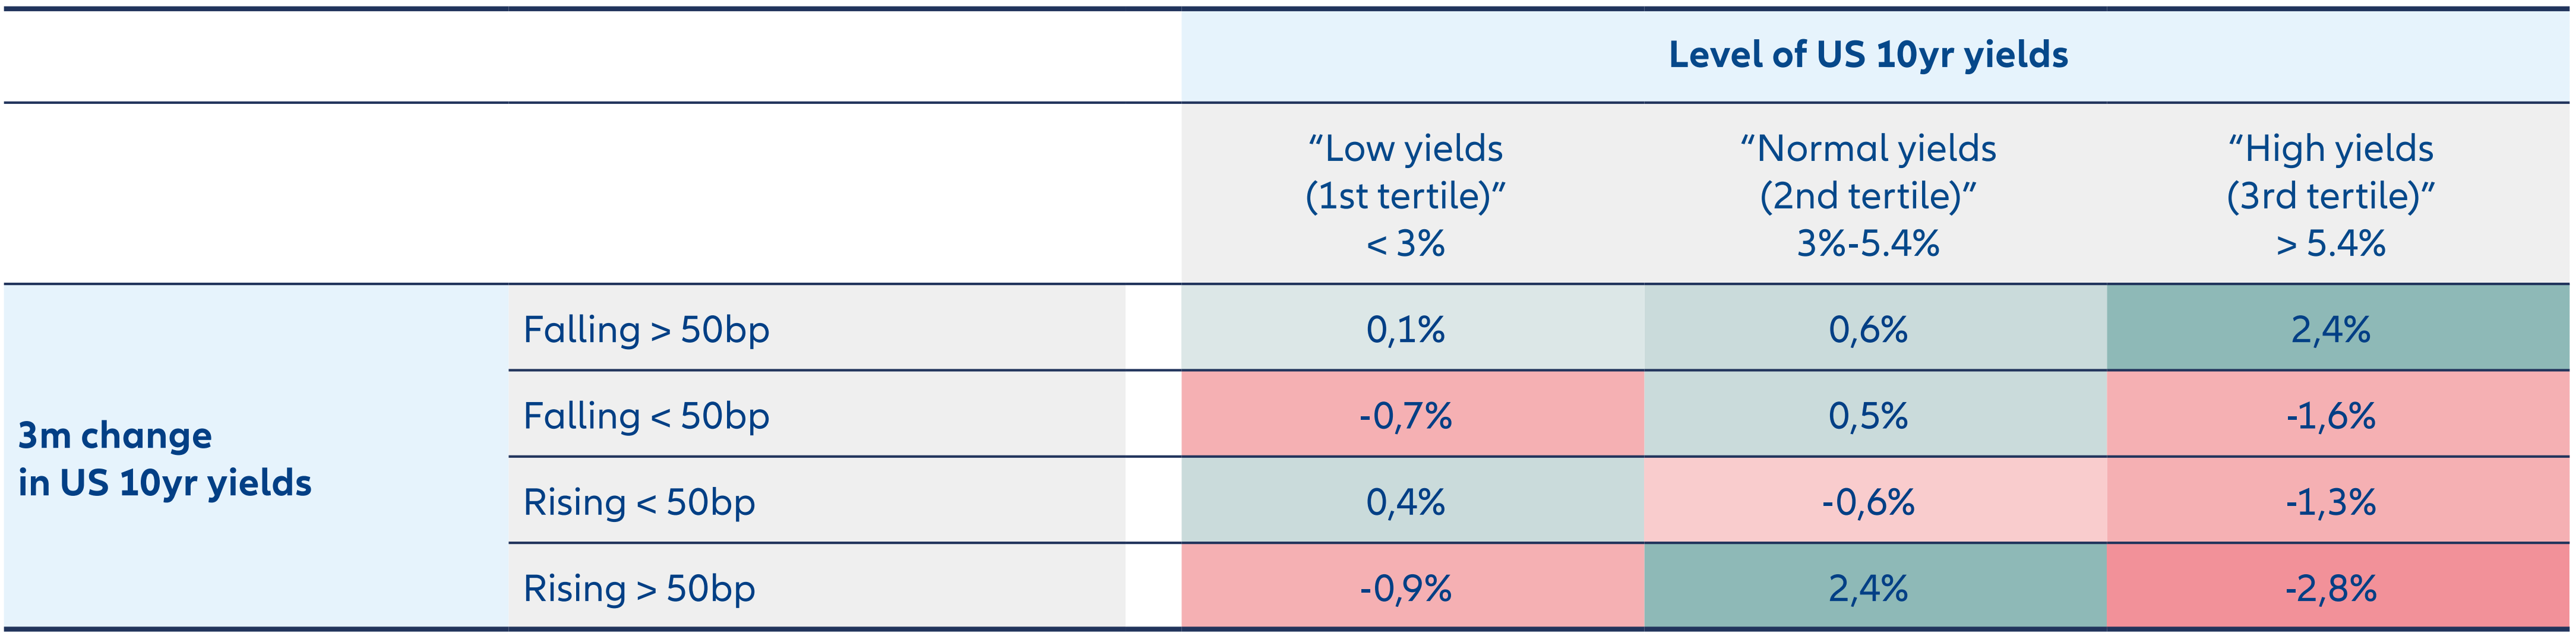
As Exhibit 5 shows, a strong decline in yields typically produces US small cap outperformance no matter the absolute yield level. However, the average outperformance was most pronounced when the yield decline occurred in the context of a high absolute yield level (average 2.4% outperformance when the absolute yield was above 5.4%). Equally noteworthy is the finding that during high yield environments, US small caps consistently underperformed large caps except when yields had strongly declined.
Exhibit 5: Falling yields boost US small caps most amid high absolute yields
Source: Bloomberg, AllianzGI, 31 January 2024. Yield regimes based on rolling three-month time periods January 1988 to January 2024. Past performance, or any prediction, projection or forecast, is not indicative of future performance.
One plausible explanation for this phenomenon could lie in the higher economic exposure of small cap stocks to interest rates compared to large caps, owing to higher net debt-to-EBITDA2 ratios. Since 2000, the average net debt-to-EBITDA ratio was 2.6x for the S&P500 index (large caps) but 4.0x for the Russell 2000 index (small caps). This illustrates how higher yield levels can increase challenges in meeting interest rate obligations for small caps, and why falling yields are generally welcomed by capital market participants.
Importantly in the context of today’s conditions, a strong decline in yields given a “normal” absolute yield level of 3-5.4% has historically produced an average outperformance of 0.6% for US small caps over large caps in the subsequent three-month period (highlighted yellow in Exhibit 5).
Still, it is important to recognise that while yield levels and movements play a significant role in determining the relative performance of US small caps versus large caps, there are numerous other indicators that warrant analysis. Additional factors include, but are not limited to, valuation, earnings expectations, and sector compositions including their respective prospects in the business cycle.
Multi asset flexibility an advantage
Bond markets can offer valuable insights into the anticipated and relative performance of different asset classes, and by extension multi asset allocation decisions. While declining yields typically support returns in various asset classes, there are certain asset classes and relative trades – such as small caps versus large caps – which particularly tend to thrive under such conditions.
Anticipating shifts in yield levels can therefore be an advantage for active multi asset strategies. Given their wide range of available instruments and asset classes, and highly flexible mandates, such strategies can adjust exposures according to the prevailing yield regime and target classes that, on average, benefit during the prevailing environment.


